Go to the table of
contents
This section provides an introduction to Osprey, showing the overall
layout of the application as well as how to do many simple tasks.
This section assumes that you already have Osprey installed on your
computer, and it is available for you to use. If this is not the
case, please refer to section 2.
Osprey Installation.
This section also assumes that you are able to launch the Osprey
Network Visualization System and that you are familiar with procedures
for opening Osprey files. If you are unfamiliar with these
procedures, please see section 3. Opening
and Saving Files
The following is a description of the major sections
comprising the Osprey layout:
- A) ToolBar: The toolbar places the most commonly
used options in osprey at the users fingertips. Options such as
saving, zooming, and changing item colour and size are all available
via the toolbar.
- B) Gene/Edge Info: This area of the layout
displays information queried from The GRID (see section 8. The GRID ( The General
Repository of Interaction Datasets)) about a selected node or
edge in the network. For a description of what is in this area see
section 4.4 Gene/Edge Info Area
- C) Network Filters: These buttons are used to
invoke any one of the network filters available to the user (see
section 5.1 Filtering Networks)
- D) Connectivity Filters: These buttons are used
to invoke any one of the connectivity filters available to the user
(see section Connectivity Filters 5.2)
- E) Osprey Menus: All options available in Osprey,
can be accessed via these menus. For more information on the
specific options available in each menu, see section 4.2 Osprey Menus.
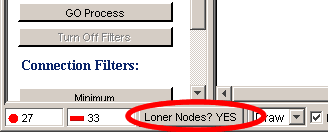
- F) Show Loner Nodes Option: By setting this
option to "YES", nodes without interactions stemming from them will
be shown on the screen. By setting this option to "NO", nodes
with no interactions will be hidden from view.
- G) Network Display Area: This is the area where
user defined networks are manipulated. When loading a graph
from a file ( or loading from a database ) all nodes and
interactions will be displayed here (see section
4.3 Networks).
- H) Status Bar: This area has buttons and
statistics that change as the status of the graph changes
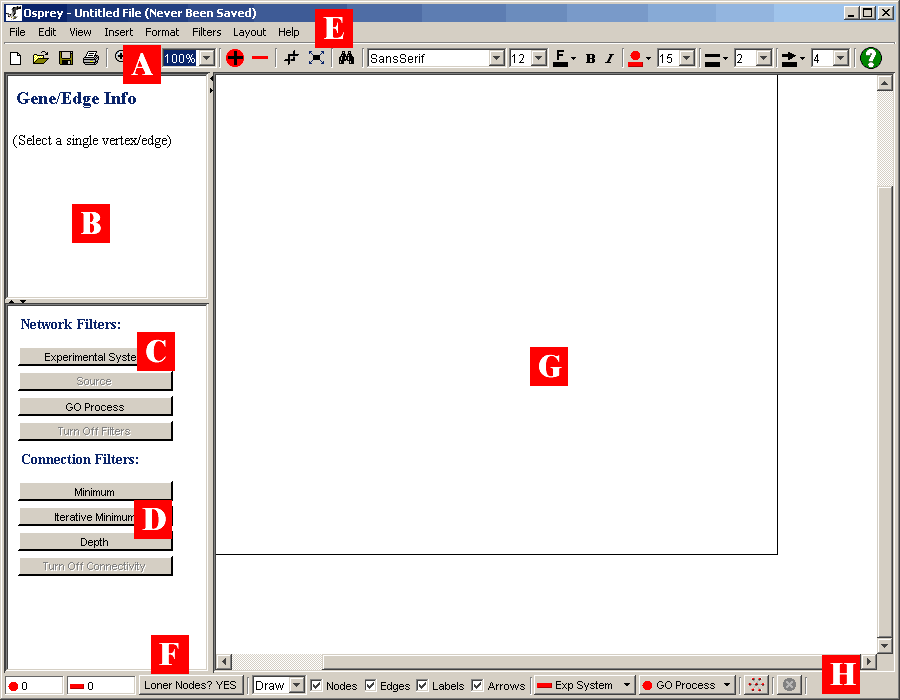
Figure 4.1 - 1: A Blank Layout of Osprey after the
application has been launched
Osprey is a menu driven application. By accessing the collection of
options stored under the different menu headings, Osprey provides the
tools necessary for manipulation and analysis of the networks. All
options available to the user can be accessed via the Osprey menus,
even though some options may have methods of access outside of the
Menu bar. The following sections will outline briefly the options
available in each of Osprey's menus.
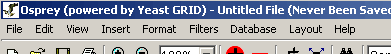
Figure 4.2 - 1: This is an isolated view of the menus
available in Osprey
The Osprey File Menu contains many of the options for writing to
files, as well as opening from files. The following is a listing of
each of the options available in the file menu, with a brief
description of what service the option provides.
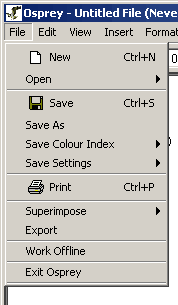
Figure 4.2.1 - 1: The Osprey File Menu
- New: This option creates a new blank network that
can be used to start developing a network from scratch
- Open: Use this menu to access the options for
opening one of the many file types recognized by Osprey. For an
outline of the files recognized by Osprey, see section 3.1 Types of Files Opened by Osprey.
There are two options under open (see figure 4.2.1 - 2):
- Standard: opens a file that you have
previously saved using Osprey.
- Dataset: opens one of the pre-made datasets
included with Osprey (see figure 4.2.1 - 3), see secton 3.1.4 for details.

Figure 4.2.1 - 2: The Options available in the Osprey
File Menu
- Save: This option is used to save files that have
been opened by Osprey, or have been previously saved
- Save As: Use this option to save files that
have not been previously saved or you wish to save as an alternative
name
- Save Colour Index: Can be used to save the
current set of colours used to extenuate annotation within Osprey to
SVG, PNG or JPG images (see section 4.6
Saving Colour Indices. There are two options under this menu:
- Only visible: This saves an image of the
colours currently used by osprey. It will only save visible
colours, so colours that have been filtered will not be saved.
- Both Visible and Invisible: This saves an
image of the colour index that includes both visible and
invisible colours used in annotation on the current graph.
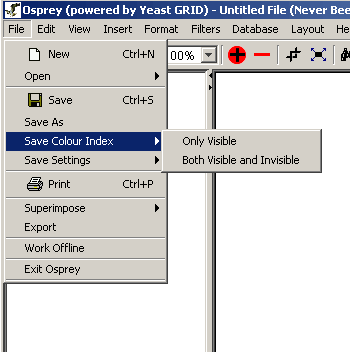
Figure 4.2.1 - 4: The Save Colour Index submenu
options
- Save Settings: This option can be used to save
options customized by the user for automatic initialization each time
that the application is run. There are two options under this menu:
- Advanced Settings: Advanced Settings
include all the settings in the Advanced Settings Menu as well
as all user defined node, edge, labels, arrow sizes and colours.
This option will take all these settings and will initialize
Osprey with them each time the application is run.
- Colour Settings: Colour Settings are all
the colour index settings in the Go Process index, Experimental
Colour index and Source index. By changing colour settings, you
will affect only the colours on the network when colouring the
graph by user defined colours mode, see section 7.1 Graph Colouring. When
colouring by default or by Osprey File Colours, these colour settings
will not apply.
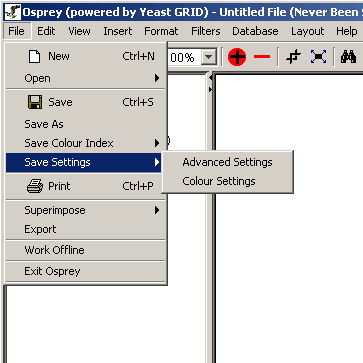
Figure 4.2.1 - 5: The Save Settings submenu options
- Print: This option will take the graph currently
displayed in the Network Display Area, and print the graph to a printer
attached to your computer.
- Superimpose: "To lay or place (something) on or
over something else" [http://www.dictionary.com/search?q=Superimpose].
The superimpose option will allow for overlaying additional files onto
an existing network in Osprey. There are two options under this menu:
- Standard: Superimposes any one of the three
recognized file formats. See section 3.1
Types of Files Opened by Osprey for details.
- Dataset: Superimposes one of the pre-made
datasets included with Osprey (see figure 4.2.1 - 3), see section 3.1.5 for details.
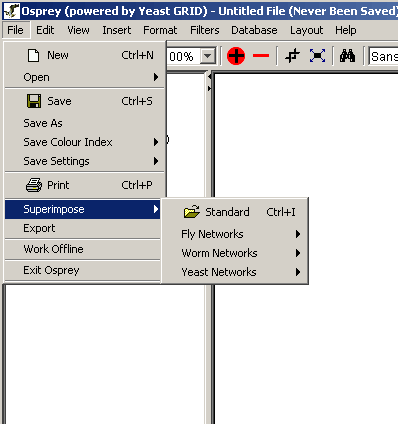
Figure 4.2.1 - 6: The Superimpose submenu
- Export: Use this option to take the current
network displayed by Osprey and save it to an image for
incorporation into figures, or for viewing and manipulation in other
applications, such as Adobe Photoshop or Macromedia Fireworks. Osprey
can currently export to SVG, JPG, or PNG images.
- Work Offline: This option is available for those
users who do not have a readily available connection to the internet. Note:working
offline will limit your options within Osprey.
- Exit Osprey: This menu option will exit the
application
The Osprey edit menu contains many options for manipulating a
currently displayed graph. The following is a listing of each of the
options available in the edit menu, with a brief description of what
service the option provides:
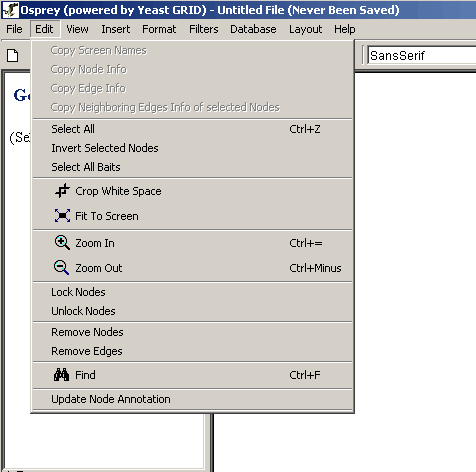
Figure 4.2.2 - 1: The Osprey Edit Menu
- Copy Screen Names: Click on this option to copy
all the currently selected screen names to the systems clip board.
- Copy Node Info: Selecting this menu item will
copy all the annotation information for the selected genes to the
systems clip board.
- Copy Edge Info: This option will copy all the
edge info for all the selected edges to the systems clip board.
- Copy Neighboring Edges Info of selected Nodes:
When clicked this will copy any Edge info of the selected node/s to the
systems clip board.
- Select All: Click on this option to select all
of the vertices and edges currently visible on the network.
- Invert Selected Nodes: Selecting this menu item
will select all the nodes that are not currently selected and
unselect all the currently selected nodes.
- Crop White Space: This option will get rid of all
excess white space around the graph and will move the graph to the upper
left to save the most space on the Network Display Area.
- Fit to Screen: When clicked this will adjust the
zoom percentage (between 25% - 125%) to best fit the network
completely on your current screen.
- Zoom In: This will make the network appear larger
on the screen increased by 1%.
- Zoom Out: This will make the network appear
smaller on the screen decreased by 1%.
- Lock Nodes: This option will take all of the
selected nodes on the graph, and will lock them in place so that
they are unaffected by automatic layout procedures such as Automatic
Relax.
- Unlock Nodes: Use this feature to take any nodes
that have been locked in place and allow them to be moved by
automatic layout procedures.
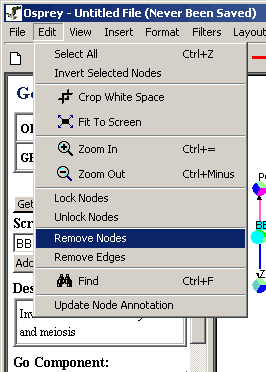
- Remove Nodes: This will take any nodes currently
highlighted in the network and permanently remove them.
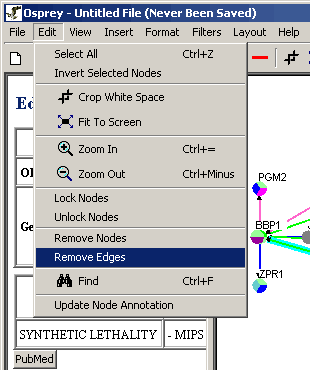
- Remove Edges: This will take any edges currently
highlighted in the network and permanently remove them.
- Find: This will search for a node by its gene
name, orf name or screen name.
- Update Node Annotation: This will connect to the
GRID and download the latest Node Annotations, see section 4.4.4 Update Annotation
The View Menu provides a variety of options for changing the look
and feel of the currently displayed graph. The following is a listing
of each of the options available in the view menu, with a brief
description of what service the option provides:
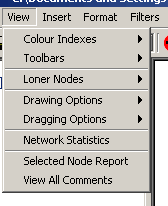
Figure 4.2.3 - 1: The Osprey View Menu
- Colour Indexes: The Colour indexes submenu
contains options for viewing each of the colour sets used for
annotation on nodes and edges in Osprey. There are three options
under this menu:
- Experimental Systems: Choosing this colour
index will show a listing of colours used to describe
experimental system annotation on edges. It also provides the
ability to manipulate these colours.
- Sources: Choosing this colour index will
show a listing of colours used to describe source annotation on
edges. It also provides the ability to manipulate these colours.
- GO Process: Choosing this colour index will
show a listing of colours used to describe GO Process annotation
on nodes. It also provides the ability to manipulate these
colours.
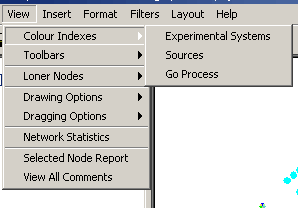
Figure 4.2.3 - 2: The Colour Indices Submenu
- Toolbars: The toolbars submenu contains options
for viewing the Standard Buttons toolbar and the Status Bar. There
are two options under this menu:
- Standard Buttons: When this option is
checked, the toolbar at the top of Osprey will be visible. When
it is not checked, the toolbar will be invisible providing
additional room for the Network Display Area.
- Status Bar: When this option is checked,
the status bar at the bottom of Osprey will be Visible. When it
is not checked, the status bar will be invisible providing
additional room for the Network Display Area.
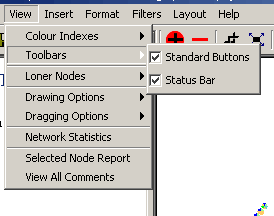
Figure 4.2.3 - 3: The Toolbars Submenu
- Loner Nodes: The loner nodes submenu contains
options for turning the loner nodes filter on or off making nodes
without edges visible or invisible. There are two options under this
menu.
- Show: When this option is selected, it will
turn the Loner Nodes filter off, which will show all nodes on
the screen, regardless of the number of interactions stemming
from them
- Hide: When this option is selected, it will
turn the Loner Nodes filter on, which will hide nodes on the
screen with zero interactions stemming from them.
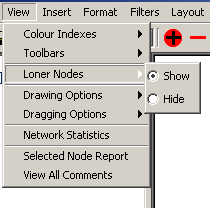
Figure 4.2.3 - 4: The Loner Nodes Submenu
- Drawing Options: An Osprey network is in
drawing mode, when the graph is stationary, and no nodes are
currently being moved around the screen. There are four options
under this menu.
- Nodes: By clicking this option you can
specify whether or nodes are displayed while in Drawing mode.
- Edges: By clicking this option you can
specify whether or edges are displayed while in Drawing mode.
- Labels: By clicking this option you can
specify whether or labels are displayed while in Drawing mode.
- Arrows: By clicking this option you can
specify whether or arrows are displayed while in Drawing mode.
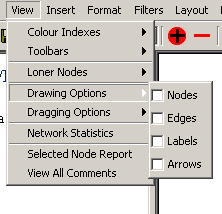
Figure 4.2.3 - 5: The Drawing Options Submenu
- Dragging Options: An Osprey network is in
dragging mode whenever a single node, or a group of nodes are being
dragged about the network display area. There are four options under
this menu.
- Nodes: By clicking this option you can
specify whether or nodes are displayed while in dragging mode.
- Edges: By clicking this option you can
specify whether or edges are displayed while in dragging mode.
- Labels: By clicking this option you can
specify whether or labels are displayed while in dragging mode.
- Always: By clicking this option you can
specify whether the above three options are drawn for all nodes
or for only the ones currently being dragged.
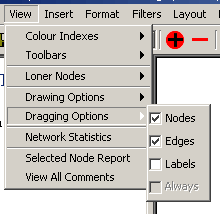
Figure 4.2.3 - 6: The Dragging Options Submenu
- Network Statistics: This option will show
several statistics about the currently displayed network.
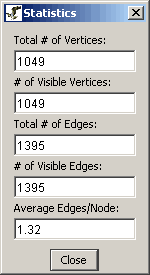
Figure 4.2.3 - 7: Network Statistics
- Selected Node Report: This option will display
all gene info about the currently selected nodes
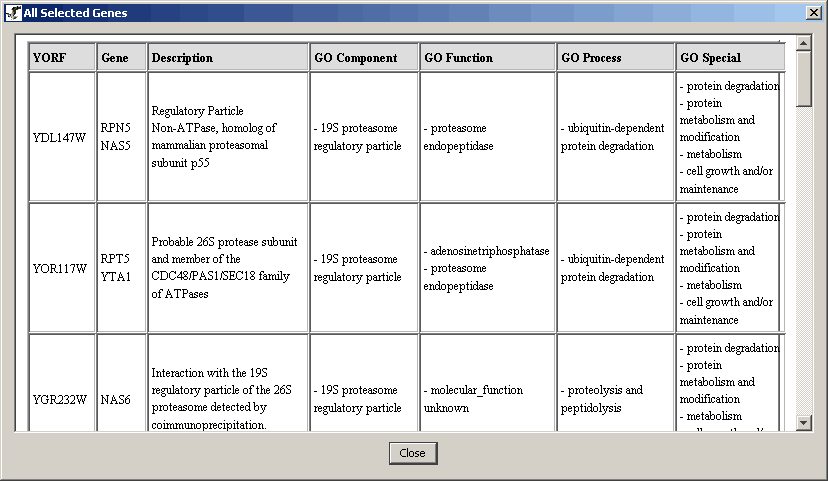
Figure 4.2.3 - 7: Selected Gene Report
- View All Comments: This option will display all
comments that have been made on any nodes currently in the Network
Display Area.
The insert menu provides several options for adding additional
information, such as interactions and nodes, to a currently displayed
network. The following is a listing of each of the options available
in the insert menu, with a brief description of what service the
option provides:
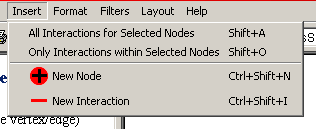
Figure 4.2.4 - 1: The Osprey Insert Menu
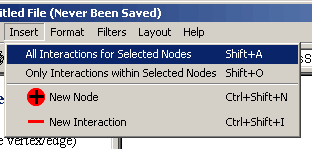
- All Interactions for Selected Nodes: This
option will query The GRID and retrieve all interactions stored for
the currently selected nodes.
- Only Interactions within Selected Nodes: This
option will query The GRID and retrieve all interactions stored that
are contained only within the selected set of nodes.
- New Node: This option provides the ability to
add individual nodes manually by name.
- New Interaction: This option allows for manual
addition of interactions between nodes currently in the network.
The format menu provides several options for adding additional
information, such as interactions and nodes, to a currently displayed
network. The following is a listing of each of the options available
in the insert menu, with a brief description of what service the
option provides:
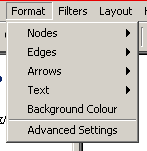
Figure 4.2.5 - 1: The Osprey Format Menu
- Nodes: The nodes submenu has options that affect
nodes; specifically colour and size
- Colour: This options provides the ability to
change the selected nodes' colour
- Size: This options provides the ability to
change the selected nodes' size
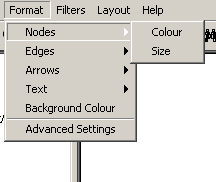
Figure 4.2.5 - 2: The Nodes Submenu
- Edges: The edges submenu has options that affect
edges; specifically colour and size
- Colour: This options provides the ability to
change the selected edges' colour
- Size: This options provides the ability to
change the selected edges' size
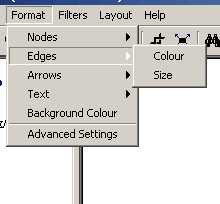
Figure 4.2.5 - 3: The Edges Submenu
- Arrows: The edges submenu has options that affect
arrows; specifically colour and size
- Colour: This options provides the ability to
change the selected arrow heads' colour
- Size: This options provides the ability to
change the selected arrow heads' size
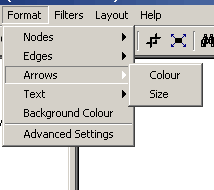
Figure 4.2.5 - 4: The Arrows Submenu
- Text: The edges submenu has options that affect
labels; specifically colour, font, and visibility
- Colour: This options provides the ability to
change the selected labels' colour
- Font: This options provides the ability to
change the selected labels' font, size and style
- Show: When this is clicked, it makes selected
labels visible
- Hide: When this is clicked, it makes selected
labels not visible
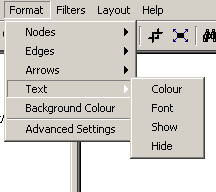
Figure 4.2.5 - 5: The Text Submenu
- Background Colour: This provides the ability
to change the graph's background colour
- Advanced Settings: This has all other options and
settings that were not mentioned above, such as layout settings and
colouring modes
The filters menu has the same functionality as the buttons in the
bottom left hand corner window. It offers access to the Network
filters which filter the graph depending on network features such as
Source or Experimental System, and Connection filters which filter the
graph depending on number of connections each node has.
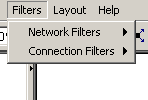
Figure 4.2.6 - 1: The Filters Menu
- Network Filters: These filters, filter the
nodes on the graph depending on network features such as
Experimental System, Source and Go Process. Note: Only
the Currently viable filters will be enabled. To change the
available filters change the colouring mode (see section 5. Filters for more detail)
- Experimental System: Select this option to
invoke the Experimental System Filter
- Source: Select this option to invoke the
Source Filter
- Go Process: Select this option to invoke the
Gene Ontology Process Filter
- Turn off Filters: This option turns off a
network filter, if one of them is turned on
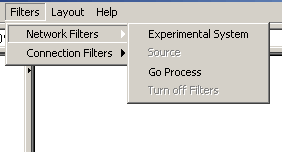
Figure 4.2.6 - 2: The Network Filters Submenu
- Connection Filters: These filters filter the
nodes on the graph depending on the number of connections they have
with each other
- Minimum: Select this option to invoke the
connection minimum filter, it will only keep nodes with a chosen minimum
amount of connections before any nodes are removed
- Iterative Minimum: Select this option to
invoke the iterative connection minimum filter, it is similar to
the above filter except it only keeps nodes with a chosen
minimum amount of nodes after all nodes are removed
- Depth: Select this option to invoke the
connectivity depth filter, it keeps nodes that are a chosen number of
connections deep from the selected nodes
- Turn off Filters: This option turns off any
connection filters if any were turned on
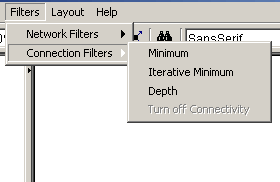
Figure 4.2.6 - 3: The Connection Filters Submenu
This menu offers all the different ways to layout nodes in an Osprey
Network. It ranges from the relax algorithm to a simple circular layout
to a more advanced Dual Spoked Ring Layout that attempts to display up
to 1500 - 2000 nodes in a easily manageable format. See section 6. Layouts for more details on layouts
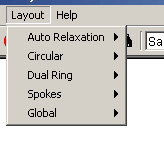
Figure 4.2.7 - 1: The Osprey Layout Menu
- Auto Relaxation: This submenu has the relaxation
algorithm which attempts to relax the the graph by separating all the
nodes and edges.
- Start Relaxation: Use this option to begin
automatic relaxation on all of the nodes currently selected in the
network.
- Stop Relaxation: When Relaxation is in
progress, Start Relaxation will be replaced by Stop Relaxation;
click it to stop the nodes from relaxing.
-
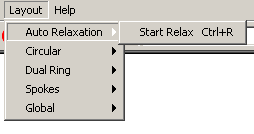
Figure 4.2.7 - 2: The Auto Relaxation Submenu
- Circular: This submenu has the circular
layouts, you can choose from.
- One Circle: This option places all the
selected nodes in a circle whose size is proportionate to the
size of the selection box.
- Concentric Circles: This option places all
the selected options in concentric circles.
- Concentric Circle Options: This option
gives the user the ability to change the number of rings as well
as the capacity of rings to achieve the best fit.
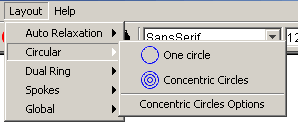
Figure 4.2.7 - 3: The Circular Submenu
- Dual Ring: The following two layouts split the
nodes into two groups, highly connected nodes in and highly
connected nodes out.
- Highly Connected In: This option places all
the highly connected nodes in the inner circle and all other
nodes in the outer circle.
- Highly Connected Out: This option places
all the highly connected nodes in the outer circle and all other
nodes in the inner circle.
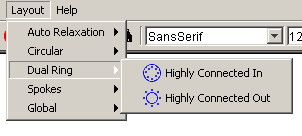
Figure 4.2.7 - 4: The Dual Ring Submenu
- Spokes: This submenu gives the user two methods
of bringing all the nodes connected to a selected nodes into a spoke
layout
- Default: This option makes sure that the
spoke does not disturb the current look of the graph, it only
brings in nodes that are not currently in the center of a spoke
layout or in between two or more spoke layouts.
- Forced: This forces all nodes that are
connected to the selected nodes to come in to the spoke layout.
- Spoke Options: This offers the user a way of
adjusting how many nodes go into each ring and how large each ring of
the spoke layout is
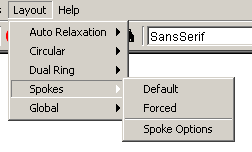
Figure 4.2.7 - 5: The Spokes Submenu
- Global: This submenu has
algorithms that act on the entire graph, disregarding whether or not
nodes are selected or locked
- Spoked Dual Ring: This is a global layout
that attempts to place a large number of nodes into two rings of
spokes layouts with the most highly concentrated spokes on the
inside ring and the least concentrated spokes layouts in the
outer ring
- Spoked Dual Ring Options: This option
allows the user to adjust the parameters that the spoked dual
ring layout uses to determine which hubs go in which ring and
how large every hub is.
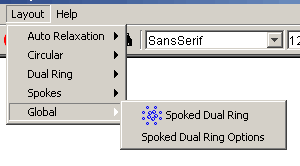
Figure 4.2.7 - 6: The Global Submenu
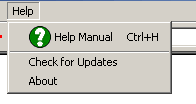
Figure 4.2.8 - 1: The Osprey Help Menu
- Help Manual: This option calls the help manual
that you are currently reading.
- Check for Updates: This option goes to the
osprey web site and checks to see if the version of Osprey you are
using is the latest one or not.
- About: Use this option to view information about
Osprey, including Osprey developers and version information.
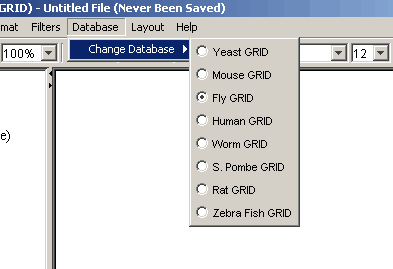
Figure 4.2.9 - 1: The Osprey Database Menu
- Change Database: This option allows you to
change the database Osprey is connected too, see section 7.10
"Changing Databases" for details.
In this section, we will examine a simple Osprey network and some of
the options that accompany them.
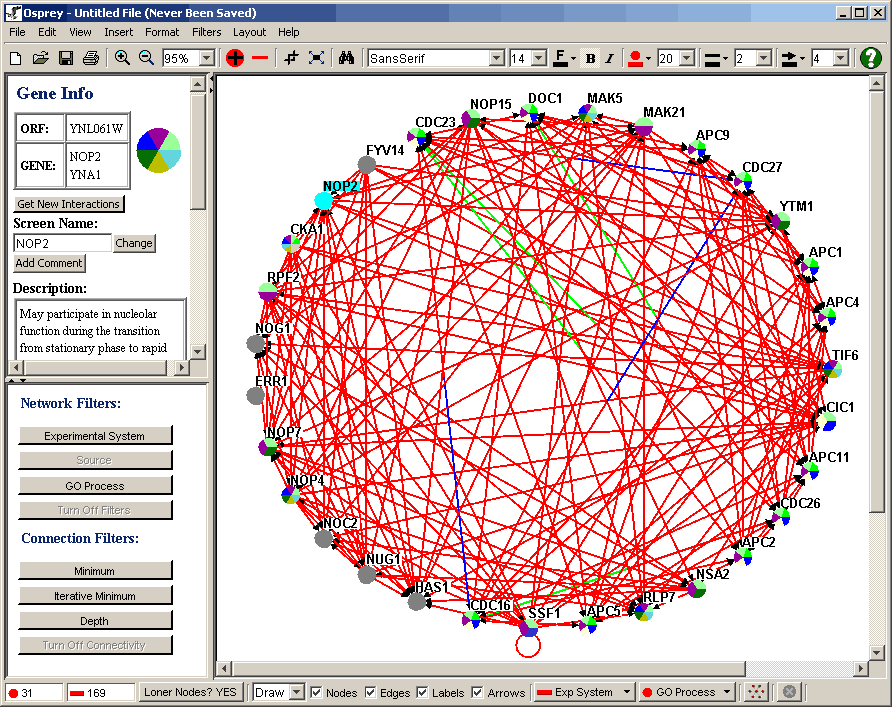
Figure 4.3 - 1: A Simple Example Network
| 4.3.1 Network
Display Area |
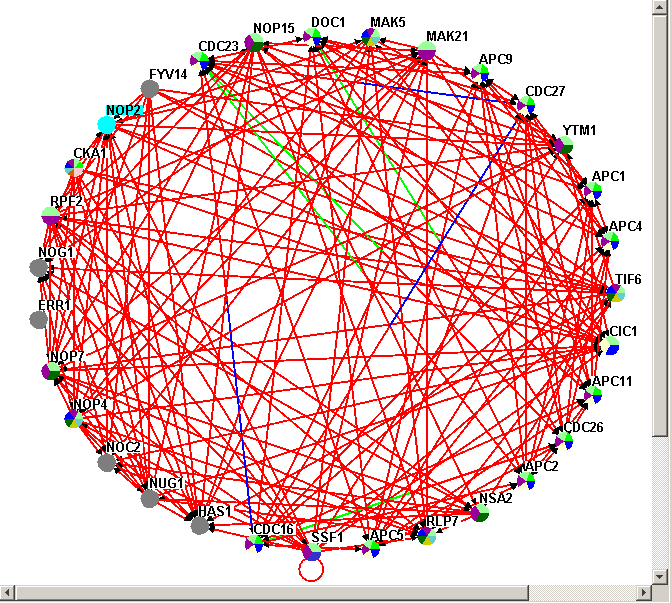
Figure 4.3.1 - 1: The Network Display Area
The Network Display Area (NDA) is the most powerful
section of the Osprey application. The NDA is used to display
all information regarding nodes and interactions. Here, nodes
are represented by colourful circles, and interactions/edges are
represented by colourful lines. Interactions can be shown using user
defined, experimental system, or sources to determine colouring (see
section 7. Osprey Preferences and
Customization). Nodes can be shown using user defined, or
Gene Ontology Process categories to determine colouring (see section 7. Osprey Preferences and Customization). Any
interactions removed or added to Osprey, are displayed in this
area.
The NDA provides many options for working with
networks. By left-clicking on a node or an edge using a mouse, the
node or edge will be selected. Selected nodes can be dragged and
placed anywhere within the Network Display Area. For more
information on manipulating networks, see section 4.3.2
Manipulating the Network .
| 4.3.2
Manipulating the Network |
There are many ways that a network can be manipulated using Osprey.
This includes basic things such as moving individual nodes and
selecting and moving groups of nodes to options like removing nodes
and edges.
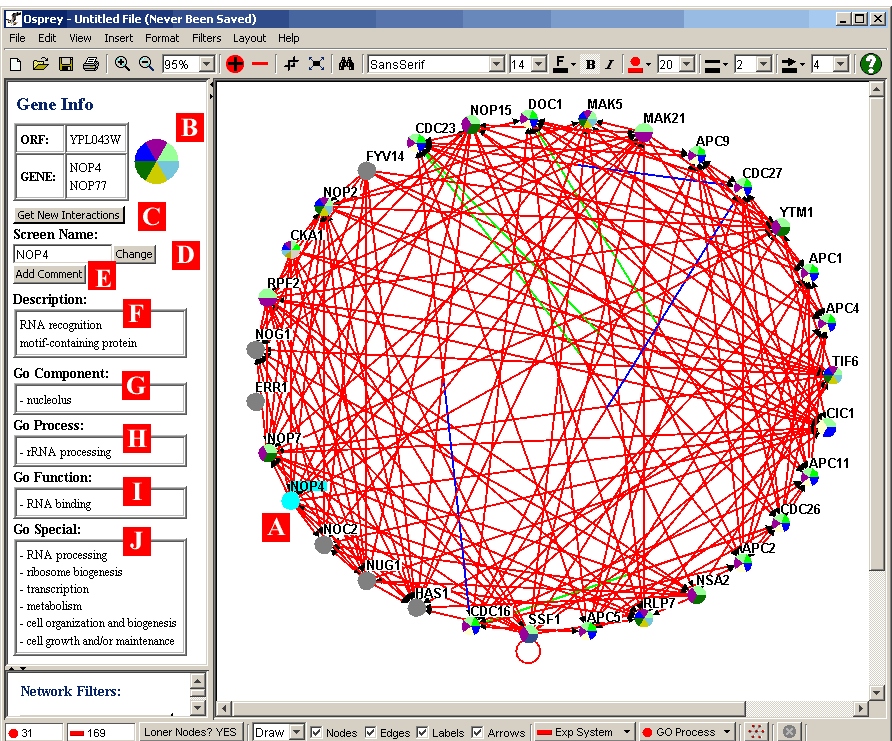
Figure 4.3.2.1 - 1: Network with a single node
selected
When a single node is clicked on in the Network Display Area, that
node becomes highlighted ( i.e. (A) in Figure 4.3.2.1 - 1 ). A
selected node will have additional database information displayed
about it, as soon as it is clicked. This information will be
shown in the Gene/Edge info area on the left hand side of
Osprey. The following describes briefly the information shown in
the Gene/Edge Info area for a selected node:
- B) Specific Gene Info: At the top of the area, specific
information about the gene is displayed. In the table on the
left hand side, ORF names and Gene/Alias Names are displayed.
On the right hand side, a zoomed in image of the node itself is
displayed. This zoomed in node will show the colours it
currently represents.
- C) Get New Interactions Button: Clicking this button will
query the database, and retrieve a list of interactions involving
the selected node that are not currently displayed in the Network
Display Area. See section 4.5 Adding Interactions
for more information about adding interactions.
- D.) Ability to change the current screen name.
- E.) Allows the user to add comments to any selected gene.
- F) Description: This section displays a plain text description of
the currently selected node. This description will be
retrieved from the underlying database.
- G, H, I) Gene Ontology Information: These three sections display
the three major categories used by the Gene Ontology
Consortium. Namely, Go Component, Go Process, and Go Function
respectively. The specific categories corresponding to the
selected node are shown in this area.
- J) Gene Ontology Special: This section of the Gene/Edge Info area
shows the Gene Ontology Special categories used for this gene. GO
Special categories are the ones used for colouring of nodes.
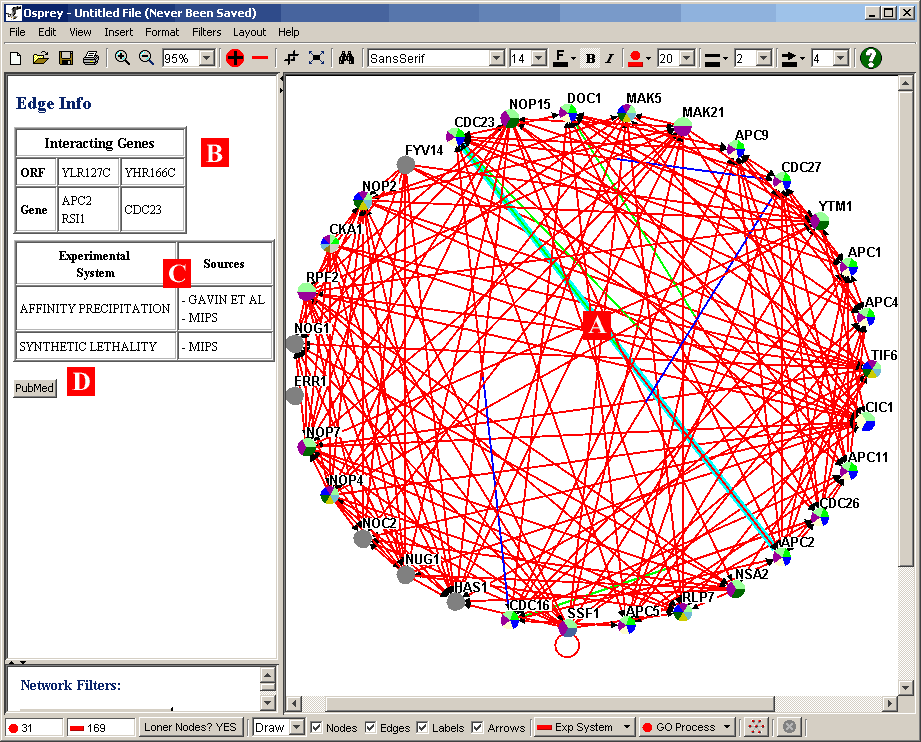
Figure 4.3.2.2 - 1: Network with a single edge
selected
When a single edge is clicked on in the Network Display Area, that
edge becomes highlighted ( ie. (A) in Figure 4.3.2.2 - 1 ). A
selected edge will have additional database information displayed
about it, as soon as it is clicked. This information will be
shown in the Gene/Edge info area on the left hand side of
Osprey. The following describes briefly the information shown in
the Gene/Edge Info area for a selected edge:
- B) Interacting Genes: At the top of the Gene/Edge Info area, when
an edge is selected, information about genes participating in an
interaction will be shown. Information such as the ORF names
and Gene/Alias names will be displayed.
- C) Experimental System / Sources: This table shows the various
experimental systems and sources that correspond to the selected
edge. Although the edges will not be coloured by both
simultaneously ( see section 7.1 Graph
Colouring ) this table will still reflect both sets of information.
- D) PubMed ID: A link to any PubMed listing on a given interaction.
Note: Selecting multiple edges can be done by
holding the ctrl button and clicking on all the desired edges
| 4.3.2.3 Moving
Individual Nodes |
By clicking and holding the left mouse button on a single node, you
can drag a node to different places on the screen. This may take a
little practice as it requires a little bit of coordination. This
technique is ideal for placing nodes in a format that makes networks
suitable for use as published figures.
| 4.3.2.4
Selecting Multiple Nodes |
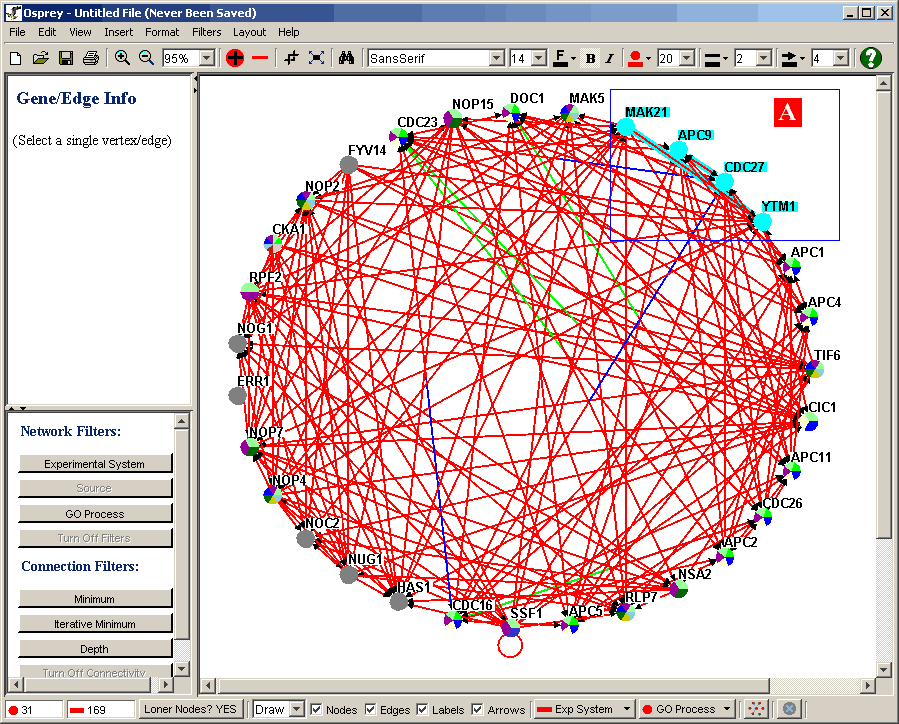
Figure 4.3.2.4 - 1: Our tutorial network with a box
being dragged to select multiple nodes
Osprey also allows for selecting of multiple nodes in the
network. This is done by encompassing the nodes in a selection
rectangle. To encompass the nodes in a selection rectangle,
simply left click and hold the mouse button in an unoccupied area of
the Network Display Area ( ie. One with no nodes or edges ) and drag
the resulting rectangle until the nodes you want selected are all
inside the rectangle ( ie. (A) in the above figure 4.3.2.4 ). When
you release the mouse button, all of the nodes inside the rectangle will
be selected.
Note: The other way to select nodes is to hold the
ctrl button on your keyboard while clicking on the nodes you would
like to select.
| 4.3.2.5 Moving
Multiple Nodes |
With multiple nodes selected ( see section 4.3.2.4
Selecting Multiple Nodes ) simply left-click and hold the mouse
button on any one of the selected nodes. While holding the
mouse, you can drag the entire group of selected nodes and place them
anywhere in the Network Display Area.
Follow these steps to remove a node (and all its edges). There are
currently two ways of doing this:
1.) The Menu Bar
2.) Right-Click Menu
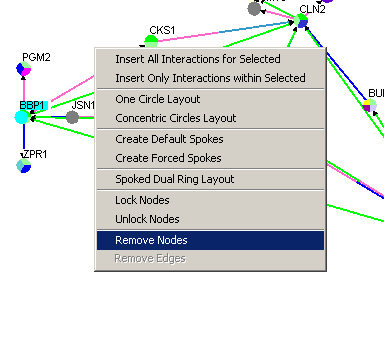
Figure 4.3.2.6 - 2 Remove Nodes Right-click menu
Follow these steps to remove an edge. There are currently two ways
of doing this:
1.) The Menu Bar
2.) Right-Click Menu
- Select an edge (or several nodes by holding the ctrl button
and clicking on all the desired edges)
- Right-click on an empty area of the Graph
- Click on Remove Edges
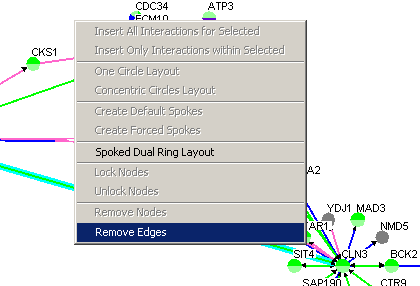
Figure 4.3.2.7 - 2 Remove Edges Right-click menu
|
4.3.2.8 Showing Loner Nodes |
Loner nodes are nodes that do not have any edges coming out of them
(or into them). They can either be left visible, or removed from the
graph and set to invisible.
There are currently two ways of changing the visibility option of
loner nodes:
1.) The Menu Bar
- Click on the "View" menu in the Menu Bar
- Click on the "Loner Nodes" submenu
- Select either the Show or Hide radial button
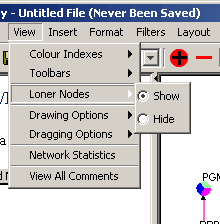
Figure 4.3.2.8 - 1 Loner Nodes Submenu
2.) The Status Bar button
| 4.3.3 Network
Display Area Command Menu |
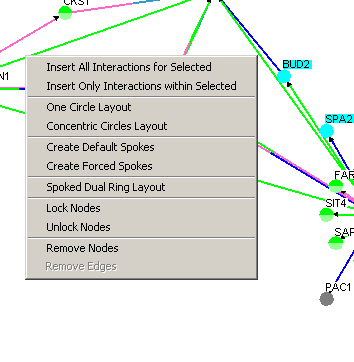
Figure 4.3.3 - 1: Image of all the possible options
on the Network Display Area Command Menu
The Network Display Area Command Menu can be launched by
right-clicking anywhere in the Network Display Area. Depending on
whether nodes or edges have been selected, the options available on the
command menu may vary. Each of these options is outlined as
follows:
- Insert All Interactions for Selected: This
option will query The GRID and bring in all nodes that have an edge
with currently selected Nodes.
- Insert Only Interactions within Selected: This
option will query The GRID and bring in all edges that can currently
go between selected nodes.
- One Circle Layout: This will place all selected
nodes into a circle.
- Concentric Circle Layout: This will place all
selected nodes into concentric circles.
- Create Default Spoke: This option will bring
all nodes that are connected to currently selected nodes into spoke
layouts without disturbing the graph (it will leave nodes that are
in the center of other spokes layouts and spokes that are shared
between two or more spoke layouts untouched).
- Create Default Spoke: This option will bring
all nodes that are connected to currently selected nodes into spoke
layouts disregarding where these nodes were before.
- Spoked Dual Ring Layout: This is a global
layout that will attempt to place a large amount of nodes into an
easily manageable layout.
- Lock Nodes: This option will lock any
selected genes in place, so that they will not be affected by any
layout algorithm (except the global ones).
- Unlock Nodes: This option will unlock any
locked selected genes, allowing their position to be manipulated by all
layout algorithms.
- Remove Nodes: This option will permanently
remove any selected nodes from the network. See section 4.3.2.6 Removing Nodes
for more details.
- Remove Edges: This option will permanently
remove any selected edges from the network. See section 4.3.2.7 Removing Edges
from more detail.
The Gene Info Area displays information about the selected node.
This information is obtained from the Grid database.
- If the gene is known as the one in figure 4.4 - 1 all the data
about this gene will be displayed in this section
- If the data is not know or if the added gene is a custom gene
this area will not display much information as in figure 4.4 - 2
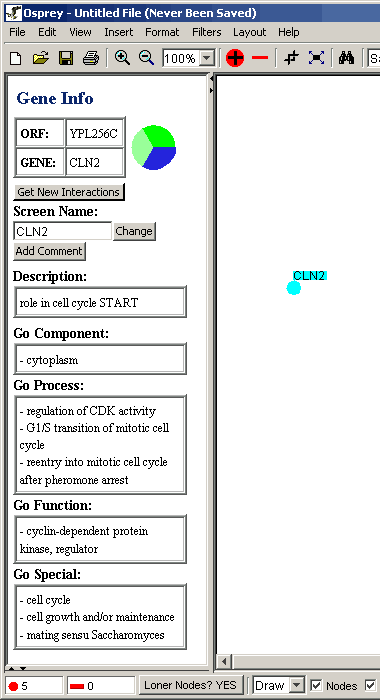
Figure 4.4 - 1 Gene Info for CLN2
|
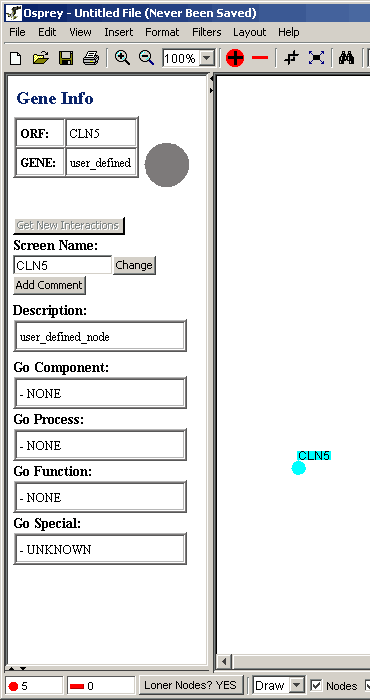
Figure 4.4 - 2 Gene Info for CLN5 (unknown)
|
|
4.4.1 Changing Screen Name |
To change the name of a selected node on your graph follow these
steps:
- Click on the desired node
- Click on the text box under the Screen Name label (shown below in
Figure 4.4.1 - 1)
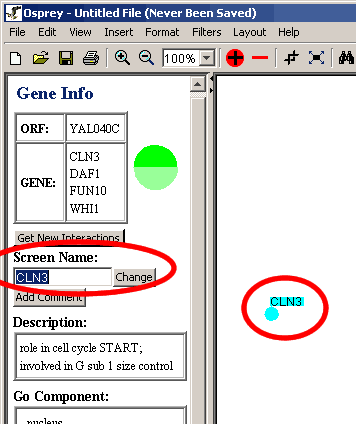
Figure 4.4.1 - 1 Screen Name
- Type in the desired name.
- Then Click on Change.
- The change will be reflected on the graph, but nothing in the
database or the gene info will change (shown below in Figure 4.4.1 -
2).
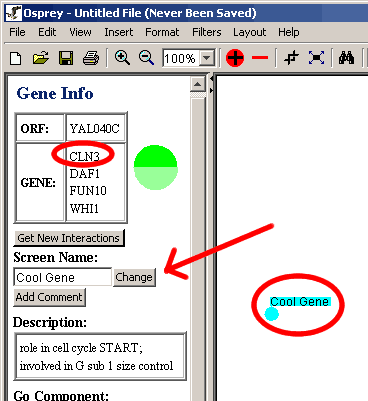
Figure 4.4.1 - 2 Change Screen Name
Osprey offers the option of adding comments to selected genes that
can be viewed and updated as needed.
Follow these steps to add a comment:
- Click on the desired gene.
- Click on the "Add Comment" button.
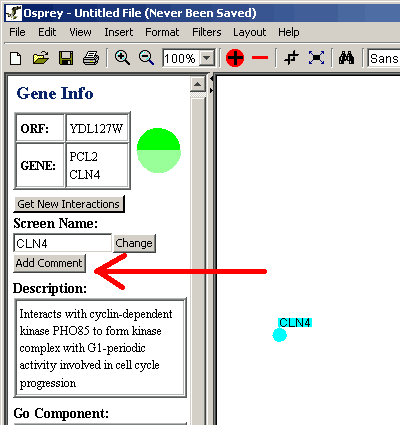
Figure 4.4.2 - 1 Add Comment Button
- A window will pop-up for you to type your comment in.
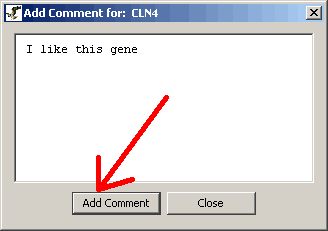
Figure 4.4.2 - 2 Add Comment window
- After adding your comment click on the "Add Comment" button.
- To close the comment window without making any changes click on
close.
- The original "Add Comment" button on the Gene/Edge Info area will
change to "View Comment" to reflect the fact that there is a comment
saved now.
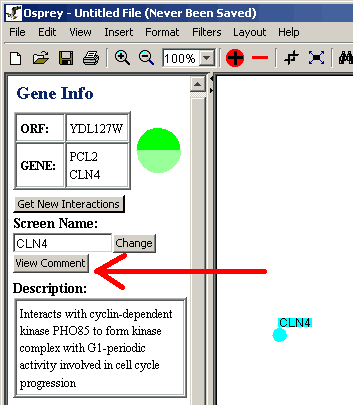
Figure 4.4.2 - 3 View Comment Button
- To view, edit or remove the comment click on the View Comment
button.
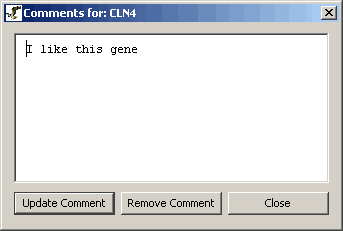
Figure 4.4.2 - 4 View Comment Window
- To modify the comment, type in the desired modifications then
click on the "Update Comment" button.
- To remove the comment completely click on the "Remove Comment"
button.
- To close the comment without making changes click the close
button.
-
|
4.4.3 Viewing Selected Node Report |
You can view the gene info for two or more genes in a report like
table. Follow these steps to find out how:
- Select the desired nodes.
- From the Main Menu bar select the "Selected Node Report" menu
item under the view menu.
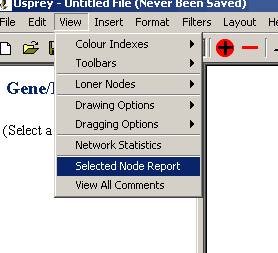
Figure 4.4.3 - 1 Selected Node Report menu item
- Click on it and a report window will appear
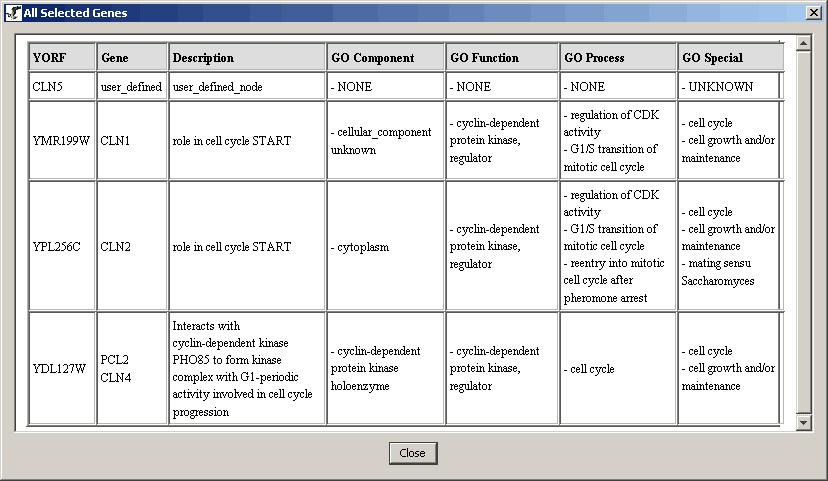
Figure 4.4.3 - 2 Selected Nodes Report Window
Note: This table can be copied and pasted into a
spread sheet program (using the ctrl+c and ctrl+v hotkeys), but this
option is not endorsed by this program.
This option will connect to the GRID database and may change the
annotation of your layout to the latest annotations available: Follow
these steps to call this function:
- Click on the "Edit" Menu in the Menu Bar
- Click on Update Node Annotation
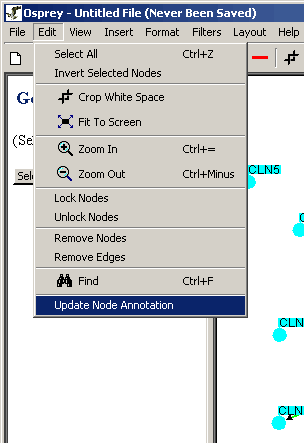
Figure 4.4.4 - 1 Update Node Annotation
- A warning message will appear asking you if you are sure you want
to do this (it may take a long time if you have a slow internet
connection)
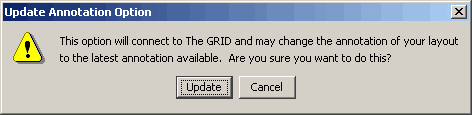
Figure 4.4.4 - 2 Update Note Annotation Warning
- If you click Update Osprey will connect to The GRID and update
your annotation
If you click on an edge, the Gene/Edge Info area will show you the
edge info. It will display the node's given Gene and ORF names as well
as Experimental System, Source info, and any PubMed links.
The ability to incorporate new interactions into an already existing
network is one of the most powerful features that Osprey has to offer.
Interactions can be added to the graph from a large selection available
in Ospreys underlying support database ( see section 8 The GRID ( The General Repository
of Interaction Datasets ) ).
There are three major areas of Osprey that can be used to add new
interactions. Namely:
- The Orf Info Area
- The Network Display Area Command Menu (Right-click menu)
- The Edit Menu
| 4.5.1 From the
Orf Info Area |
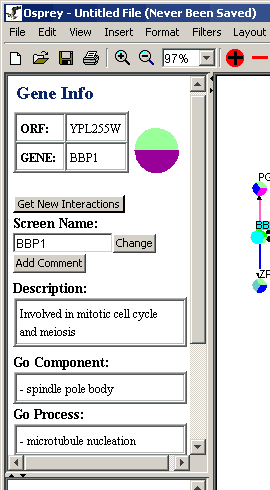
Figure 4.5.1 - 1 Orf Info Area
The gene info area is used to display additional information about a
selected orf in the Network Display Area. In addition to this, it
also provides a button that allows for the incorporation of new
interactions into the already established graph. To get this
process started, simply highlight a node on the graph, and click the
"GET NEW INTERACTIONS" button on the Gene Info Area. When this
button is clicked, a window with a listing of new interactions is
launched:
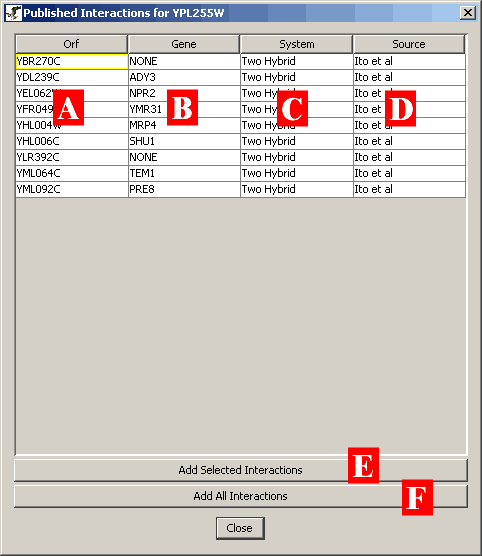
Figure 4.5.1 - 2: An example listing of additional
interactions for a selected orf in a network
This listing of interactions has several key areas crucial to
deciding which interactions you want to add to the existing network:
- A) ORF: This field shows the orf name of any other orfs
interacting with the selected node.
- B) Gene: This field shows some of the common gene names and
aliases for other genes that interact with the selected node.
- C) System: This field shows the experimental system that was used
to derive the particular interaction.
- D) Source: This field shows the source that reported this
interaction within the support database.
You can select any of the interactions listed on this screen by
clicking on them with the left-mouse button. To select multiple
interactions, simple click and hold the left mouse button and drag
through the list to select as many interactions as desired. Once
you have selected interactions, you can add them by clicking on the "Add
Selected Interactions" button ( pictured as (E) in Figure 4.5.1 - 2
). This will take these new interactions and incorporate them into
the network currently stored in the Network display area.
If, at any time, you simply want to add all interactions available
in the listing, click the "Add All Interactions" button ( pictured as
(F) in Figure 4.5.1 - 2 ).
| 4.5.2 From the
Network Display Area Command Menu and Insert Menu |
The Network Display Area Command Menu and the edit menu offers two
easy methods for incorporating new interactions into a network:
1.) Adding all interactions to selected vertices (section 4.5.2.1 Adding all interactions to selected vertices).
2.) Adding only interactions within Selected Vertices
(section 4.5.2.2 Adding only interactions within
Selected Vertices).
| 4.5.2.1 Adding
all interactions to selected vertices |
You can add ALL interactions to a single node or several nodes in
two different ways:
1) Using The Network Display Area Command Menu
(Right-click menu)
- Select the desired nodes (for more info on selecting nodes
see section 4.3.2.1 Selecting Nodes)
- Right-click in an empty area of the graph to bring up The
Network Display Command Menu
- Click on Insert All Interactions for Selected as shown
below in Figure 4.5.2.1 - 1
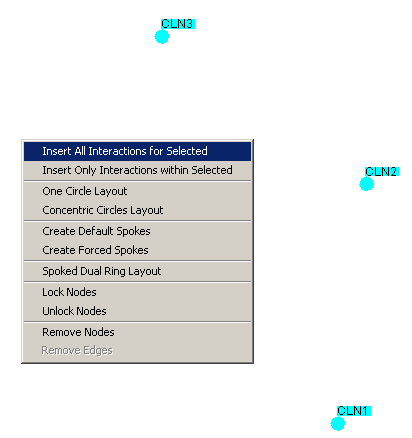
Figure 4.5.2.1 - 1: A set of selected nodes with
the Network Display Area Command Menu open
By clicking on the "Insert All Interactions for Selected"
option, all interactions stored in the underlying database for ALL of the selected vertices will be added to
the network.
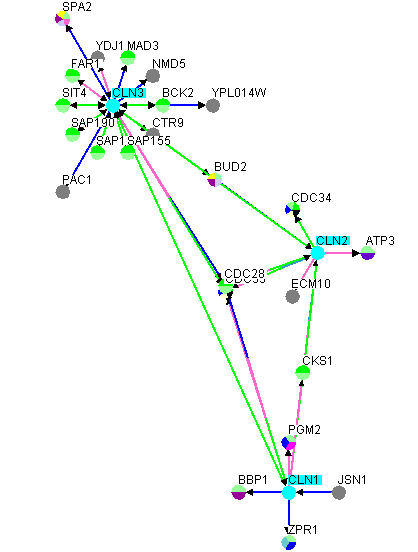
Figure 4.5.2.1 - 2: Figure 4.5.2.1 - 1
after "Insert All Interactions for Selected" has been applied to
the selected nodes
2) Using The Insert Menu
| 4.5.2.2 Adding
only interactions within Selected Vertices |
This is one of the most popular options for retrieving new
interactions, and one that is rarely seen in other network display
systems. With this option, one can retrieve interactions that
exist ONLY within a set of nodes in a
network. There are 2 ways to access this feature:
1) Using The Network Display Area Command Menu
(Right-click menu)
- Select the desired nodes (for more info on selecting nodes
see section 4.3.2.1 Selecting Nodes)
- Right-click on an empty area of the screen
- Click on "Insert Only Interactions within" as shown in
Figure 4.5.2.2 - 1
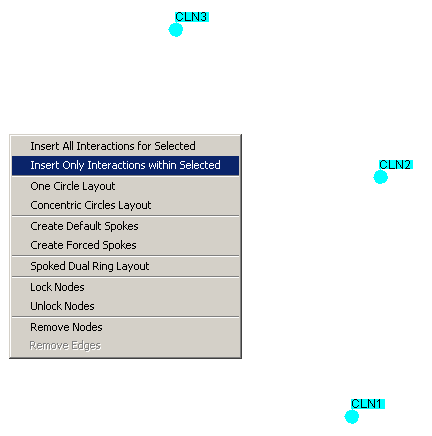
Figure 4.5.2.2 - 1: A set of nodes with no
interactions shown
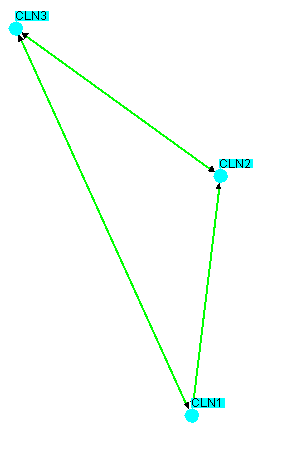
Figure 4.5.2.2 - 2: same image as 4.5.2.2 - 1
but with all interactions within the selected nodes inserted
Notice how only interactions involving only the selected nodes
were added to the network. No new nodes are ever added
when using this option. This can be very powerful for
determining connections between a core set of nodes in the
network.
2) Using The Insert Menu
- Select the desired nodes (for more info on selecting nodes
see section 4.3.2.1 Selecting Nodes)
- Click on the Insert Menu in the Menu Bar
- Click on "Only interactions within Selected Nodes" as shown
in Figure 4.5.2.2 -3
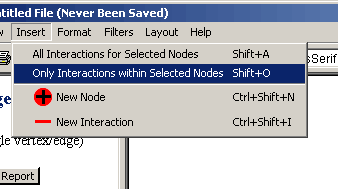
Figure 4.5.2.2 - 3: Insert Menu, Only interactions
within Selected Nodes
Colour indices show a mapping of colours used in a network to their
meaning. There are three major colour indices used by Osprey when
displaying a network:
- Go Process Index: Shows colours for each of the GO Process
categories currently displayed on the Network and used to colour the
individual nodes on the graph.
- Experimental Systems Index: Shows colours for each of the
Experimental Systems currently displayed by Osprey and used to
colour the edge segments when the graph is in Colour By Experimental
System Mode ( see section 7.1 Graph
Colouring for more details )
- Sources Index: Shows colours for each of the Sources currently
displayed by Osprey and used to colour the edge segments when the graph
is in Colour By Source Mode ( see section 7.1 Graph Colouring for more details )
To access the various colours indices, please refer to the windows
menu ( see section 4.2.5 Windows Menu )
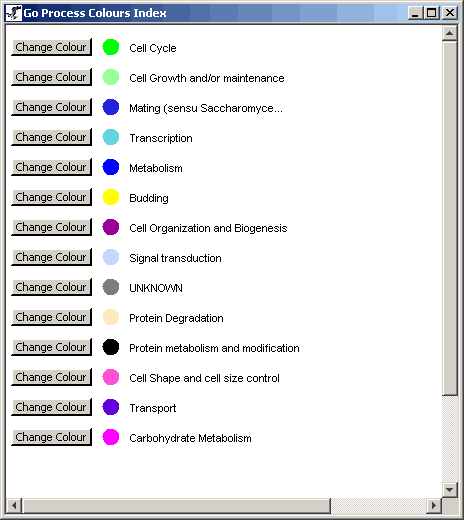
Figure 4.6.1 - 1: An example of a GO Process Index
for a given network
The GO Process Index describes the various colours used on the
individual nodes to represent Special GO Process categories. These
colours are completely customizable, and can be changed simply by
clicking on the "Change Colour" button behind any particular Go Process
category.
| 4.6.2
Experimental Systems Index |
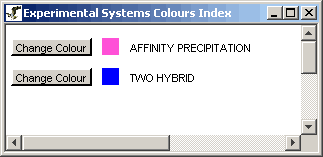
Figure 4.6.1 - 1: An example of an Experimental
Systems Index for a given network
The Experimental Systems Index describes the various colours used on
the individual edge segments used to represent the different
experimental systems. These colours are completely customizable,
and can be changed simply by clicking on the "Change Colour" button
behind any particular experimental system in the index.
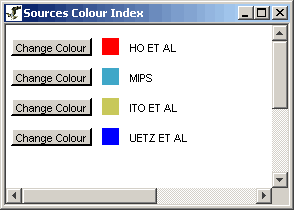
Figure 4.6.1 - 1: An example of a Sources Index for a
given network
The Sources Index describes the various colours used on the
individual edge segments used to represent the different sources of
interactions. These colours are completely customizable, and can
be changed simply by clicking on the "Change Colour" button behind any
particular source in the index.
| 4.6.4 Saving
Colour Indices |
These three colour indices can also be saved as either a JPG, PNG,
or SVG images so that they may be incorporated into figures or other
projects outside of Osprey itself. Follow these steps to save
the Colour Indices:
- Click on the Osprey "File" Menu
- Click on the "Save Colour Index" submenu
- Choose either to save "Only Visible" colours or "Both Visible and
Invisible" Colours
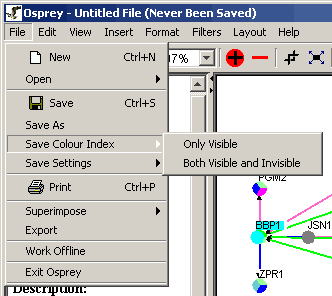
Figure 4.6.4 - 1: The Save Color Index Menu
- This option will then ask you for a location and format for which
to save the index. ( see figure 4.6.4 - 2 )
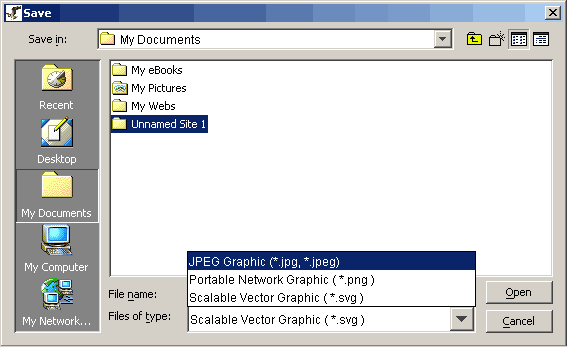
Figure 4.6.4 - 2: The File Chooser for saving a color
index
- Choose a destination to save the file, and type a name for the
index and click save to create the index. For an example of a colour
index for an arbitrary network, see the following figure ( figure
4.6.4 - 3 )
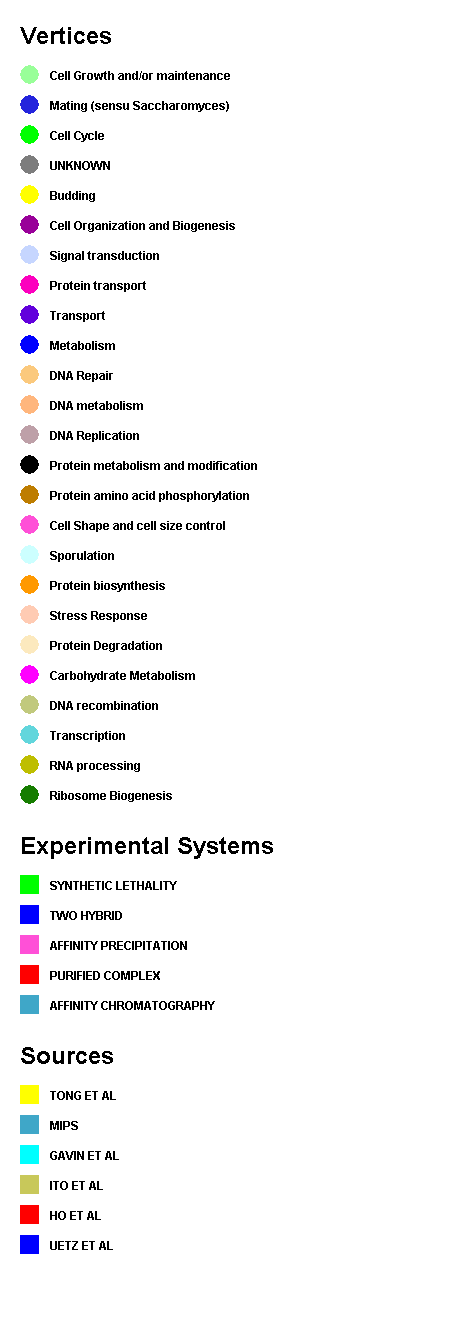
Figure 4.6.4 - 3: An example Colour Index for an
Arbitrary Network
4.7 Multiple
Organism Support
|
New to Osprey version 1.0.0+ is the ability access different databases
containing annotation information from several different organisms. As
of Feb, 2004 Osprey supports the following organisms:
1.) Yeast (Saccharomyces
cerevisiae)
2.) Human (Homo sapiens)
3.) Mouse
(Mus musculus)
4.) Fly (Drosophila melanogaster)
5.) S.
Pombe (Schizosaccharomyces pombe)
6.) Worm (C.
Elegans)
7.) Rat (Rattus
norvegicus)
8.) Zebra Fish
(Danio rerio)
All of the above databases are maintained by the GRID, which receives
their information from several different sources including SGD, NCBI,
and Locus Link. See http://biodata.mshri.on.ca/grid
for more information. See section
7.10, "Changing Databases" for information on the various ways to
change the database Osprey connects to.
Note: This option allows the
more ambitious Osprey user to create a MySQL database to maintain a
private version of interaction data. For more information on this option
please contact the Osprey administrators for more details,
ospreyadmin@mshri.on.ca.
The Osprey Administrator
E-mail: ospreyadmin@mshri.on.ca
Go to the table of
contents