Go to the table of contents
| 7. Osprey Preferences and Customization |
This section will describe several options that are available for customization within Osprey. These options include the following:
| 7.1 Graph Colouring |
The graph can be coloured by three different methods. These methods change the colours used by Osprey to colour a network. A graph can be coloured by one of the following methods:.
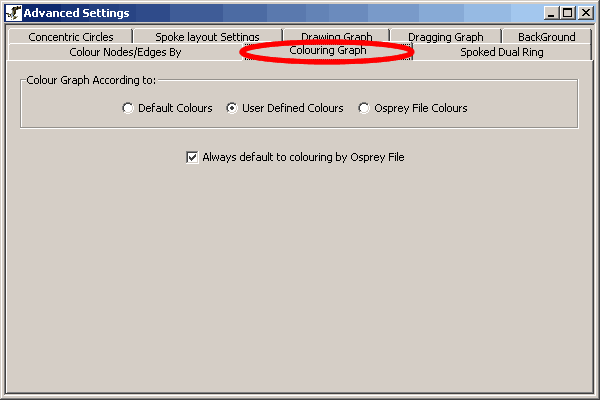
Note: By selecting the "Always default to colouring by Osprey File" checkbox, Osprey will colour opened networks by the colours stored within the file by default. If this option is not selected, Osprey will default to colouring based on user defined colours.
Figure 7.1 - 1: The Osprey advanced settings menu, with the Colouring Graph option highlighted.
| 7.1.1 Accessing Graph Colouring |
The Graph colouring options can be accessed in two ways. Both options provide quick access to the Graph colouring tab of the advanced settings dialog. The following describes the methods of access:
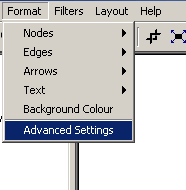
Figure 7.1.1 - 1: Accessing the advanced settings menu
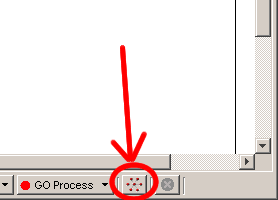
Figure 7.1.1 - 2: The Graph Colouring Button on the Status Bar
| 7.2 Drawing / Dragging Graph options |
An Osprey network can be in one of two modes at any given time:
When in either of these modes, several preferences can be set that determine what Osprey will display to the screen. When in drawing mode, users have the option of displaying any combination of Nodes, Labels, Edges, and Arrows. When in dragging mode, users have the option of displaying Nodes, Edges, and Labels. In addition to this, when in dragging mode, the user has the ability to determine whether or not these options will be reflected on all nodes in the graph, or only on nodes directly connected to the set that is being dragged, by clicking the always option. By clicking the checkbox that corresponds to any of these settings Osprey will switch between displaying or not displaying the given option.
| 7.2.1 Accessing Drawing/Dragging graph options |
Dragging and Drawing options can be accessed via two methods in Osprey:
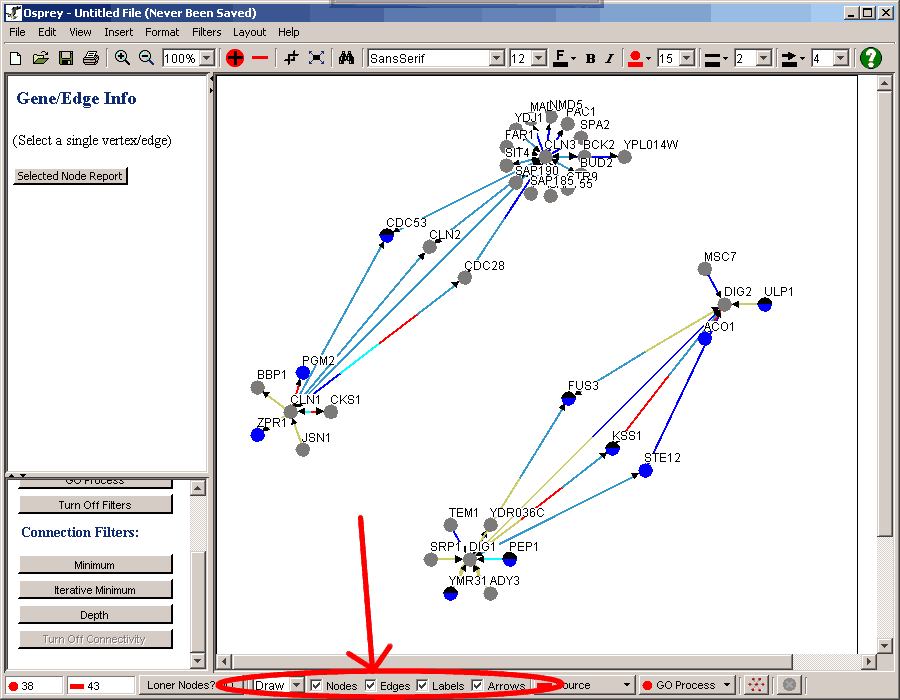

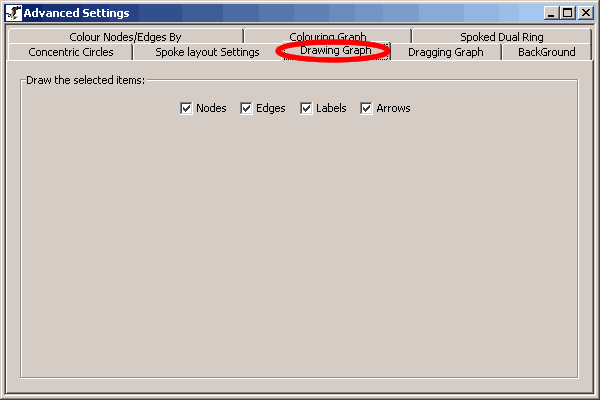
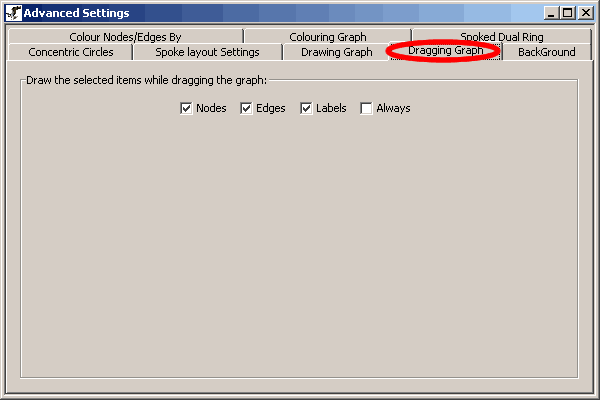
Figure 7.2.1 - 4: The Dragging Graph tab of the Advanced Settings Dialog
| 7.3 Node Options |
Nodes can be coloured by their biological process as defined by standardized Gene Ontology (GO) annotations. Nodes that have been assigned more than one GO process are represented as multicolored pie charts. Osprey currently recognizes 29 biological processes derived from the categories maintained by the GO Consortium. Users have the option of displaying nodes by these colours, or by their own set of user defined colours. By choosing GO Process, nodes will be coloured based on the appropriate GO annotation category.
Note: Each of these options will continue to apply to all new nodes that get added to the screen after the option has changed.
| 7.3.1 Choosing Method of Colouring Nodes |
There are two methods of switching the setting that Osprey uses to colour nodes in the Network display area. To view a listing of colours used when in Go Process colouring mode, view the GO Process colour index ( see section 4.6 Colour Indices ). The following describes these methods of access:
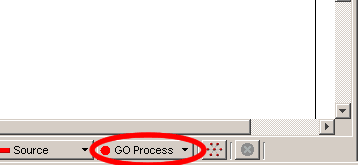
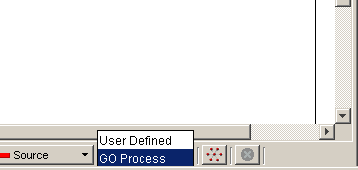
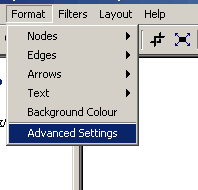
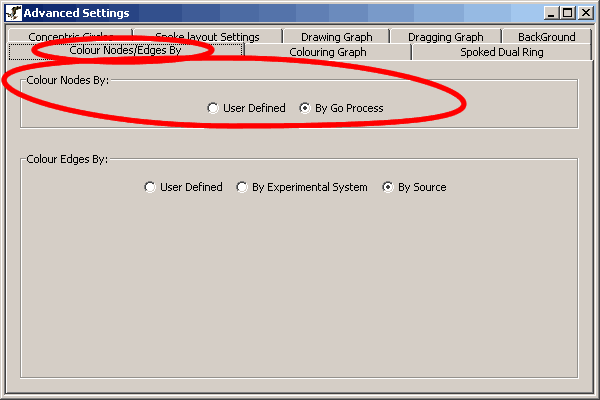
Figure 7.2.1 - 3: The Colour Nodes By Option in the Advanced Settings Menu
| 7.3.2 User Defined Node Colours |
User defined colours do not reflect any annotation stored in Osprey or The GRID. This option is used to manually colour nodes at the users discretion. Osprey is in User Defined mode whenever GO Process colours are not being used to colour nodes.
Note: To view nodes in User Defined Colours, user defined mode has to be selected as described in section 7.3.1 Choosing Method of Colouring Nodes.
When in user defined mode, node colours can be changed in the following two ways:
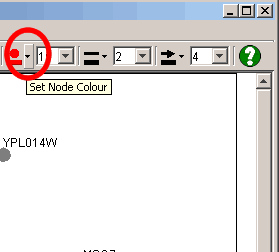
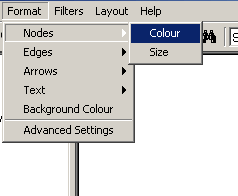
Figure 7.3.2 - 2: The Node Colour Option of the Format Menu on the Menu bar
| 7.3.3 Colour Choosing Window |
Whenever you change colours of anything in Osprey, you are presented with the Osprey colour chooser. This colour chooser has several key areas that allow for the most flexibility when customizing colour settings. These sections are as follows:
| 7.3.3.1 Swatches tab |
The "Swatches" tab has a standard set basic colours that can be picked as the colour of choice. To pick a colour from the "Swatches" tab simply click on it, the colour will appear at the bottom of the screen, then click "OK" to actually apply the colour change
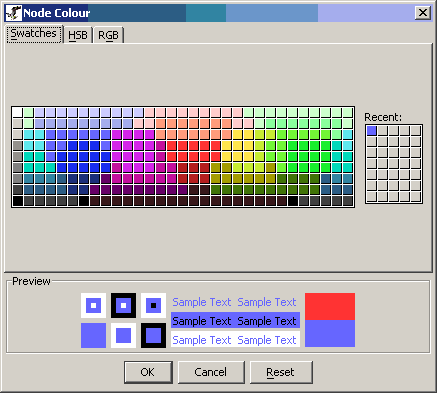
Figure 7.3.3.1 - 1: The Osprey Colour Chooser with the Swatches Tab Selected
| 7.3.3.2 HSB tab |
Hue, saturation, and brightness are aspects of color in the red, green, and blue (RGB) scheme. These terms are most often used in reference to the color of each pixel in a cathode ray tube (CRT) display. All possible colors can be specified according to hue, saturation, and brightness (also called brilliance), just as colors can be represented in terms of the R, G, and B components. [http://whatis.techtarget.com/definition/0,,sid9_gci212262,00.html]
To pick a colour from this tab you must first move the vertical chooser to determine the desired Colour hue. After the hue is chosen, you can click on the the colour window to change the Saturation and Brightness of the colour. When the desired colour is chosen click on "OK" to apply the colour to the Osprey Network Display Area.
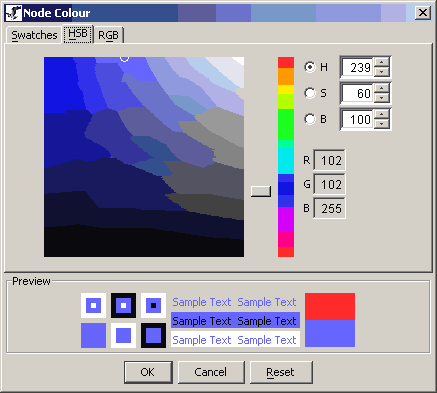
Figure 7.3.3.2 - 1: The Osprey HSB Tab of the Colour Chooser
| 7.3.3.3 RGB tab |
RGB (red, green, and blue) refers to a system for representing the colors to be used on a computer display. Red, green, and blue can be combined in various proportions to obtain any color in the visible spectrum. Levels of R, G, and B can each range from 0 to 100 percent of full intensity. Each level is represented by the range of decimal numbers from 0 to 255 (256 levels for each color). [http://whatis.techtarget.com/definition/0,,sid9_gci212900,00.html]
The RGB tab of the Colour chooser allows for greater flexibility when selecting the perfect colour for displaying in Osprey.
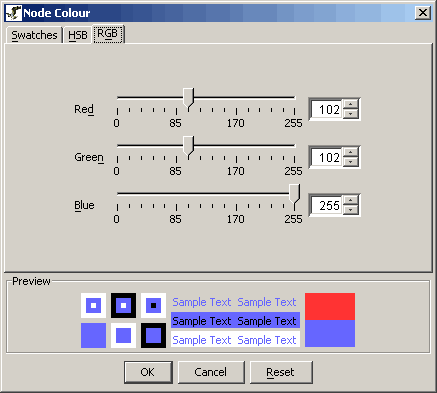
Figure 7.3.3.2 - 1: The Osprey RGB Tab of the Colour Chooser
| 7.3.4 Node Size |
In addition to changing colours of nodes, Osprey also provides the ability to manipulate the physical size of nodes on the screen. To accomplish this, we have two major methods of accessing the node size:
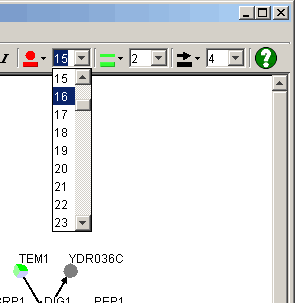
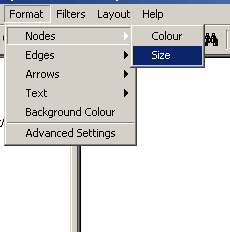
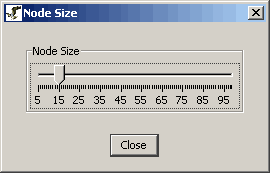
Figure 7.3.4 -3: The Node size slider
| 7.4 Edge Options |
Similar to nodes, edges also have the ability to be coloured by annotation. Osprey provides three major methods of colouring edges. They are as follows:
Note: Each of these options will continue to apply to all new edges that get added to the screen after the option has changed.
| 7.4.1 Choosing Method of Colouring Edges |
There are two methods of switching the edge colouring setting that Osprey uses to colour edges in the Network Display Area. To view a listing of colours used when in either experimental system mode or source mode, view the respective colour index ( see section 4.6 Colour Indices ). The following describes these methods of access:
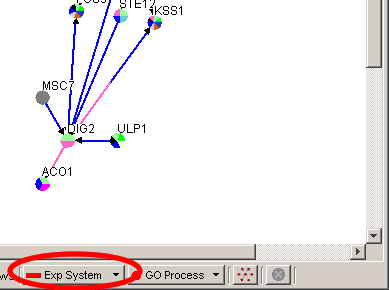
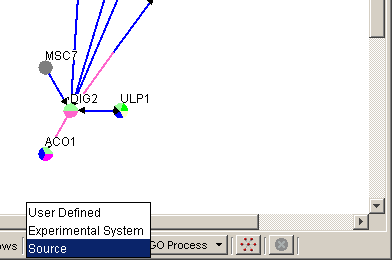
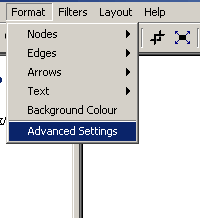
Figure 7.4.1 - 2: The advanced settings option in the "Format"
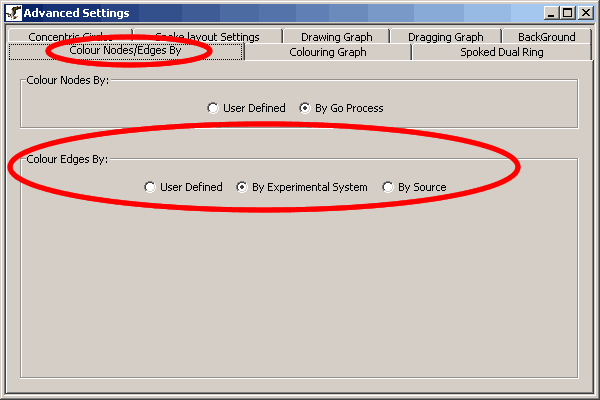
Figure 7.4.1 - 3: The Colour Edges By Option in the Advanced Settings Menu
| 7.4.2 User Defined Edge Colours |
To view User Defined Coloured Edges the user defined mode has to be chosen for edges as described in section 7.4.1 Choosing Method of Colouring Edges . There are two ways to manipulate user defined colours. It can be done in one of the following ways:
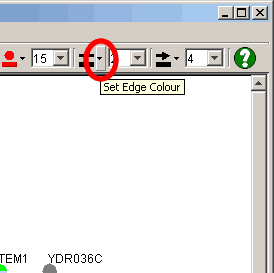
Figure 7.4.2 - 2: The Edge Colour Option of the Format Menu on the Menu bar
| 7.4.3 Edge Size |
In addition to changing colours of edges, Osprey also provides the ability to manipulate the physical size of edges on the screen. To accomplish this, we have two major methods of accessing the edge size:
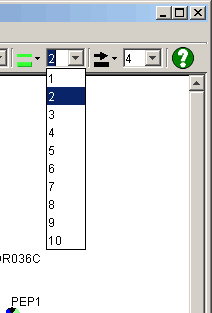
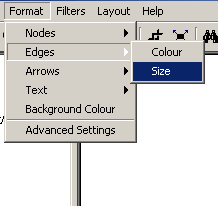
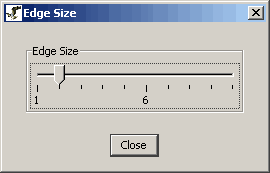
Figure 7.4.3 - 3: The Edge size slider
| 7.5 Arrow Head Options |
Similar to nodes and edges, arrow heads also have the ability to be coloured. Osprey only allows for User Defined colouring of Arrow Heads, and as such provides no additional annotation data to the Arrows themselves. Users can manipulate the colour of the arrow heads in order to manipulate the current network.
Note: Each of these options will continue to apply to all new edges with arrow heads that get added to the screen after the option has changed.
| 7.5.1 User Defined Arrow Head Colour |
There are two ways to manipulates the user defined arrow head colours. It can be done in one of the following ways:
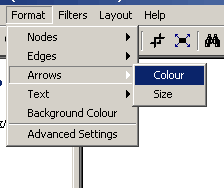
Figure 7.5.1 - 1: The Colour setting of the Arrows submenu
Figure 7.5.1 - 2: The arrow head Colour Option of the Format Menu on the Menu bar
| 7.5.2 Arrow Head Size |
In addition to changing colours of arrow heads, Osprey also provides the ability to manipulate the physical size of an arrow head in proportion to the size of the edge it resides on. To accomplish this, we have two major methods of accessing the arrow head size:
Note: Arrow Heads will change size proportionally to edge sizes
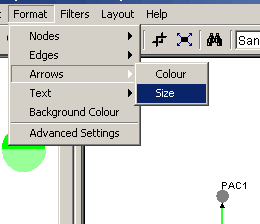
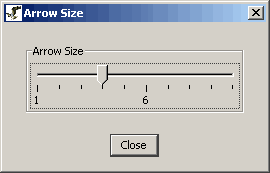
Figure 7.5.2 - 3: The Arrow Head size slider
| 7.6 Label Options |
In addition to manipulating the size of nodes and edges in Osprey, we also provide the ability to manipulate the text that comprises the label ( screen name ) of a node. The following lists the major label options that are provided:
Each of these options are readily available via the Osprey toolbar, as well as via the Osprey Menu bar.
Note: Each of these options will continue to apply to all new labels that get added to the screen after the option has changed.
| 7.6.1 Label Size |
Osprey offers two methods for manipulating the size of a label. Before attempting to change the size of a label, ensure that you have at least one node selected in the Network Display Area. The following describes the two major methods of accessing the label size:
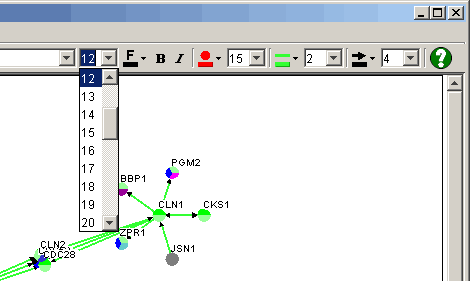
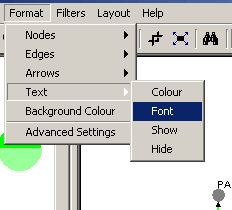
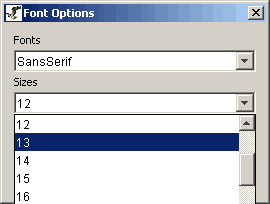
Figure 7.6.1 - 3: The font options dialog
| 7.6.2 Label Font |
Osprey offers two methods for manipulating the font of a label. Before attempting to change the font of a label, ensure that you have at least one node selected in the Network Display Area. The following describes the two major methods of accessing the label font:
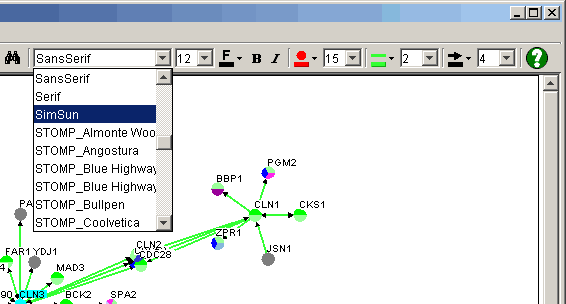
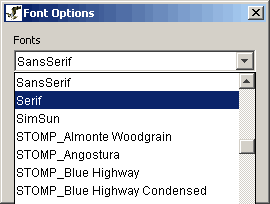
Figure 7.6.2 - 2: The Font Options Dialog
| 7.6.3 Label Style |
Osprey offers two methods for manipulating the style of a label. Before attempting to change the style of a label, ensure that you have at least one node selected in the Network Display Area. The following describes the two major methods of accessing the label style:
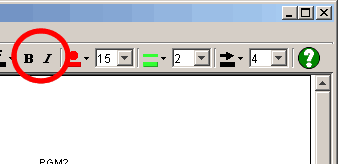
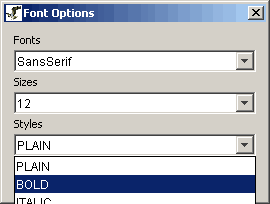
Figure 7.6.3 - 2: The Font Options Dialog
| 7.6.4 Label Colour |
Osprey offers two methods for manipulating the colour of the text in a label. Before attempting to change the colour of a label, ensure that you have at least one node selected in the Network Display Area. The following describes the two major methods of accessing the label colour:
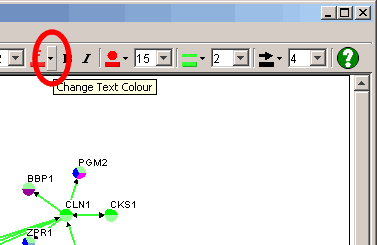
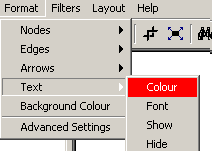
Figure 7.6.4 - 2: The Text Submenu for changing Colour
| 7.6.5 Hiding Labels |
In Osprey, you have the ability to manipulate the visibility of individual node labels. You can turn the label of any node on and off to help make figures and images. This can be accomplished in the following way:
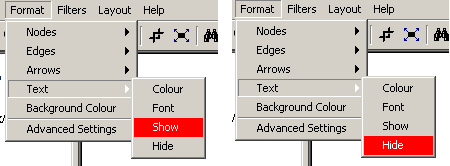
Figure 7.6.5 - 1: The Text submenu with the Show and Hide options highlighted
| 7.7 Background Colour |
In addition to changing colours and sizes of individual objects on the Network Display Area, such as nodes, edges, and labels, Osprey also provides options for changing the entire background of the Network Display Area. This option is useful for creating networks that are more colourful and allow for more colours in highlighting specific features of a graph. For example, labels or nodes that are coloured white may be important in specific circumstances, but a background of white would make these invisible. Changing the background to black or blue, however, would make it a lot easier to visualize white colour objects.
| 7.7.1 Accessing Background Colour |
The background colour can be changed using one of the following two methods:
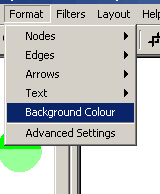
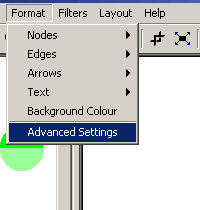
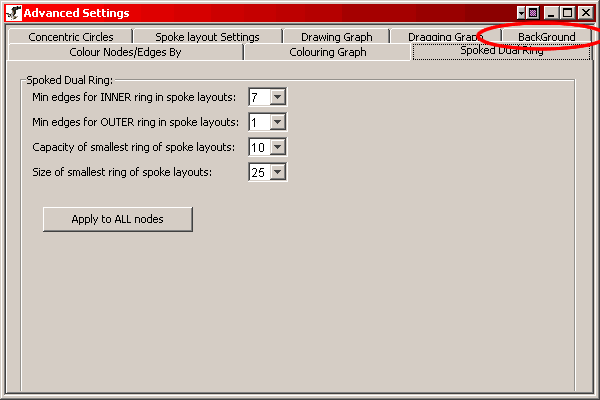
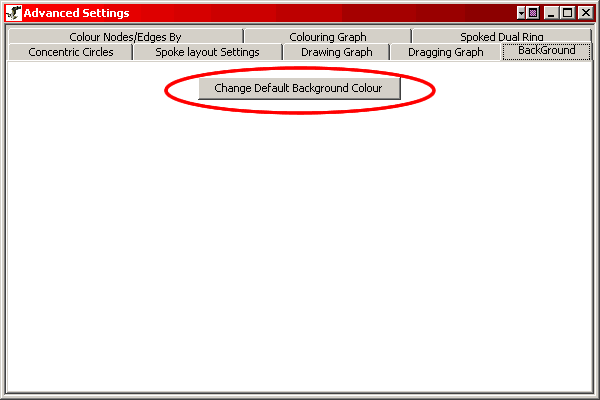
Figure 7.7.1 - 4: The Change Default Background Button in Advanced Settings
| 7.8 Saving Preferences |
Osprey provides the ability to save network preferences so that they are maintained each time the application is launched. With this, users can fully customize the look and feel of their networks, including all settings described in section 7. Osprey Preferences and Customization, and ensure that each time they launch Osprey, these settings will be maintained.
| 7.8.1 Saving settings |
Osprey provides two different options for saving settings. These options allow the user to customize certain aspects of the application so that they may be maintained with each initialization of the application. The types of settings that can be saved within Osprey are:
| 7.8.1.1 Saving Advanced Settings |
Advanced Settings include all the settings in the Advanced Settings Menu as well as all user defined node, edge, label and arrow sizes and colours. Follow these steps to save the advanced settings:
Note: This option will take all of your settings, described above, and will initialize Osprey with these settings each time the application is run.
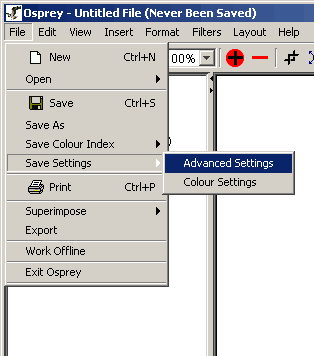
Figure 7.8.1.1 - 1: The advanced settings save option
| 7.8.1.2 Saving Colour Settings |
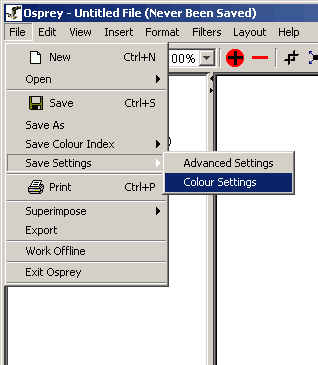
Colour settings are all the colour index settings in the Go Process index, Experimental Colour index and Source index as discussed in section 7.3.2 User Defined Node Colours and section 7.4.2 User Defined Edge Colours. These are the colour specific settings for exactly how to colour each and every annotation that is displayed on an edge or a node in Osprey. Follow these steps to save the colour settings:
Note: By changing colour settings, you will affect only the colours on the network when colouring the graph by user defined colours mode, see section 7.1 Graph Colouring. When colouring by default or by Osprey File Colours, these colour settings will not apply.
| 7.9 Proxy Settings |
In order to get Osprey to connect to the internet through a proxy
server you must do the following:
1.) Open the "Advanced Settings" window by going to the
"Format" -> "Advanced Settings" menu, see figure 7.9 -1.
2.) Check the box "Web Proxy (HTTP)" to indicate if you want to
us a proxy or not.
3.) Fill in the Proxy URL, Port, and User Name and Password if
they are required.
4.) Press "Apply Now" to apply the changes.
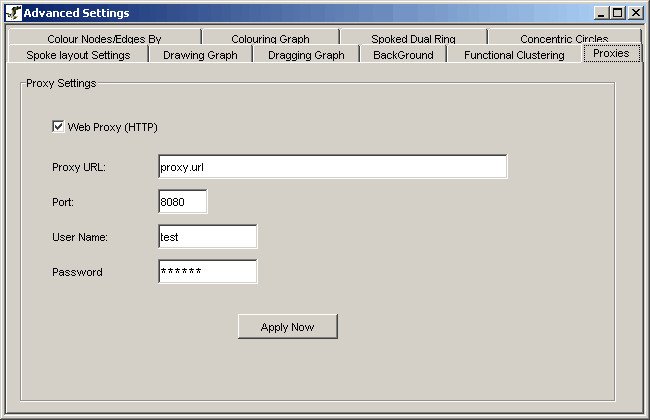
Figure 7.9 - 1: Proxy Settings
| 7.10 Changing Databases |
New to Osprey version 1.0.0+ is the ability access different
databases containing annotation information from several different
organisms. As of Feb, 2004 Osprey supports the following organisms:
1.) Yeast (Saccharomyces
cerevisiae)
2.) Human (Homo sapiens)
3.) Mouse
(Mus musculus)
4.) Fly (Drosophila melanogaster)
5.) S.
Pombe (Schizosaccharomyces pombe)
6.) Worm (C.
Elegans)
7.) Rat (Rattus
norvegicus)
8.) Zebra Fish
(Danio rerio)
All of the above databases are maintained by the GRID, which receives
their information from several different sources including SGD, NCBI,
and Locus Link.
Note: This option allows
the more ambitious Osprey user to create a MySQL database to maintain a
private version of interaction data. For more information on this option
please contact the Osprey administrators for more details,
ospreyadmin@mshri.on.ca.
There are currently 3 ways in which you can change the database in
which Osprey will connect to for interaction and annotaion information:
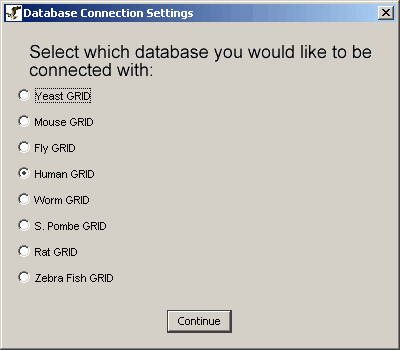
1.) On Start-up
New
to version 1.2.0 is the ability to change the database during the
inialization stage of Osprey. If it is the first time that you have run
Osprey you'll be promted with the
screen shown in figure
7-10.1. Here you'll have the ability to set the following:
a.) Select the database you would
like Osprey to connect to.
b.) Make the selection the default
database in the future.
c.) Decide whether or not you want
this screen to show up the next time you load Osprey.
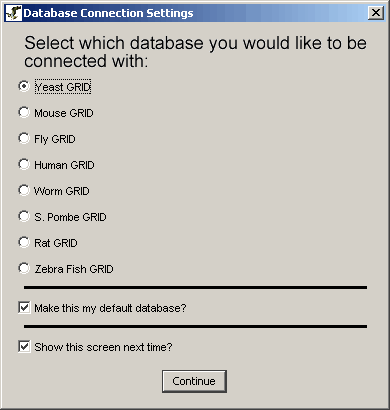
Figure 7.10 - 1: Database Setting on Osprey Start-up
NOTE: If Osprey
can not find an active network connection at start-up this screen will
not appear.
2.) Using the "Change Database" option under the
"Database" menu item
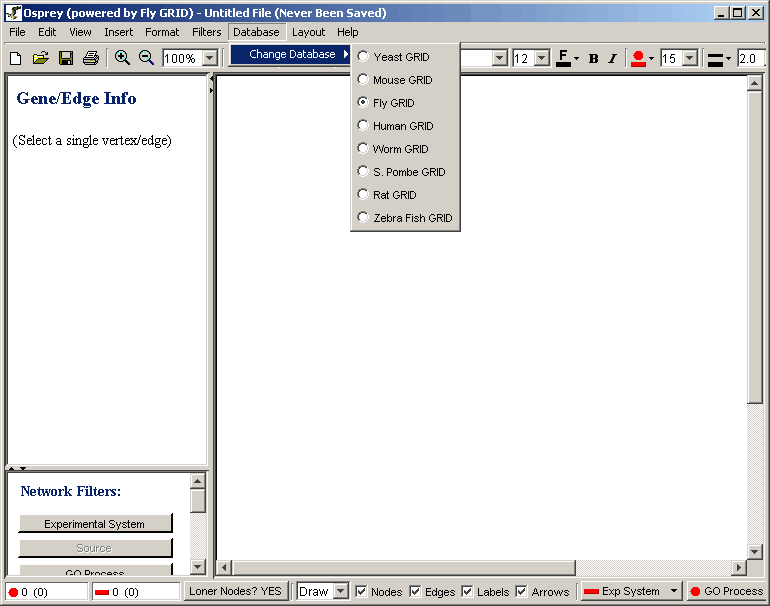
Figure 7.10 - 2: Changing database from "Database" menu item
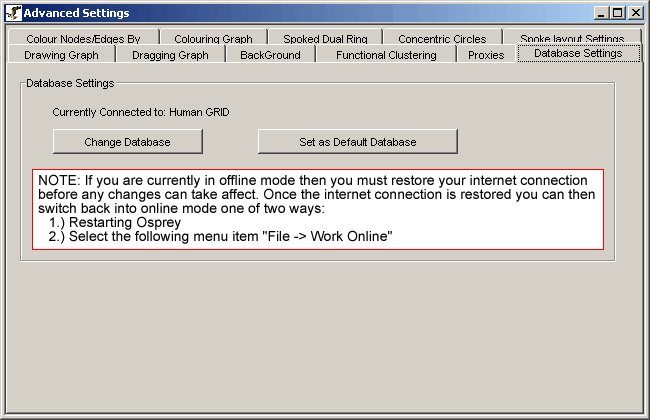
3.) Inside the "Database Settings" section of the
"Advanced Settings" window.
From the "Advanced Settings" window, see section 7.1.1 for
details on how to access, select the "Database Settings" option and
figure 7-10-3 is what you'll be
preseneted with. In this window you have the option
of simple changing the database or setting the selected database as the
default. If you where to select the "Change
Database" option you would be presented with the
window shown in figure 7-10-4 where you'll be asked to select the
database you would like to connect with. Note: if
you are
in offline mode then any changes you make to the database settings will
not take affect until you restore the network connection.
Note: By default Osprey will connect to the yeast database, if you want Osprey to default to a different database you can simple connect to the database of interest and save your settings.
The Osprey Administrator
E-mail: ospreyadmin@mshri.on.ca
Go to the table of contents